This guide provides a practical breakdown of what business intelligence dashboards are, the features that make them effective, how to design one that drives decisions, and how AI is fundamentally changing the way dashboards are built and used.
Key Takeaways
- BI dashboards aggregate data from multiple sources into a single, interactive visual interface for faster decision-making
- Must-have features: real-time updates, interactive filtering, multi-source integration, and role-based access controls
- Strategic, operational, and tactical dashboards each target a different audience — from executives tracking quarterly goals to managers monitoring daily workflows
- Effective design starts with defining the audience, selecting the right KPIs, and choosing charts that make patterns obvious
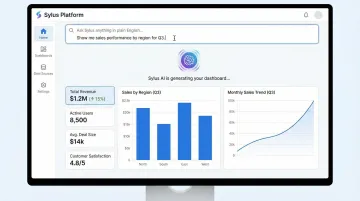
- Modern BI tools like Sylus let anyone build complete dashboards from plain-English questions — no SQL required
What Is a Business Intelligence Dashboard?
A business intelligence dashboard is a visual interface that pulls data from multiple sources—databases, data warehouses, CRMs, APIs, and SaaS tools—into a centralized view. It displays key metrics and KPIs in a format that updates automatically and enables interaction, turning raw, disconnected data into answers teams can act on immediately.
The core purpose: translate data into answers that any stakeholder can interpret without writing queries or exporting spreadsheets. According to the Nielsen Norman Group, true dashboards are "collections of data visualizations, presented in a single-page view that imparts at-a-glance information on which users can act quickly". This definition distinguishes dashboards from static reports through three characteristics:
- Live updates — data refreshes automatically, so teams monitor current performance instead of reviewing yesterday's numbers in tomorrow's report
- Interactive filtering — users drill down by time period, geography, product line, or segment without submitting new data requests
- Single-screen focus — the most important information for a specific objective lives on one screen, readable within seconds
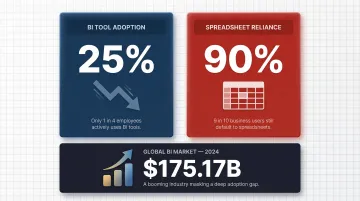
Despite the global data and analytics software market reaching $175.17 billion in 2024, employee adoption of BI tools remains stuck at just 25%, while 90% of organizations still rely on spreadsheets for critical business data. That gap usually traces back to the same root problem: dashboards built for the tool's capabilities rather than the questions real users actually need answered.
Key Features of an Effective BI Dashboard
Real-Time Data Visualization
Effective dashboards display data as it updates, not on a delay. Decision latency directly erodes competitive advantage — organizations that wait hours or days for data face up to 5% annual revenue loss due to missed opportunities and stalled execution. In retail and supply chains, lack of real-time visibility can cause stockouts to rise by 30%, leading directly to lost sales.
Real-time dashboards shift teams from reactive to proactive execution. That shift translates to 60-80% faster decision-making cycles and 10-15% higher revenue impact compared to batch-processed reports.
Customizable Layouts
Different users need different views. A CFO tracking revenue vs. a marketing manager tracking campaign spend should each see a tailored interface. Customization typically includes:
- Widget arrangement and positioning based on user priorities
- Saved views that preserve filter states and configurations
- Role-based defaults that automatically display relevant metrics to each user type
- Personalized KPI tiles that surface the metrics each stakeholder cares about most
Without this flexibility, dashboards designed "for everyone" reliably end up useful to no one.
Interactive Filters and Drill-Down Functionality
Filters let users slice data dynamically without analyst intervention. Typical segmentation dimensions include:
- Time period and date ranges
- Geography and regional breakdowns
- Product line or SKU
- Customer segment or account tier
Drill-down functionality takes this further — clicking a revenue spike, for example, reveals which products, regions, or sales reps drove the increase. This turns dashboards from static displays into exploration tools, eliminating the days-long wait for analyst follow-up.
Multi-Source Data Integration
A BI dashboard's value scales with the number of data sources it connects. The most powerful dashboards consolidate data from warehouses, SaaS tools, and operational systems into a single view — providing a complete picture of business performance without tab-switching.
The challenge is fragmentation. Data workers process an average of four unique sources per analytic input, and that fragmentation wastes 62.4 billion data and analytic work hours globally each year. When data remains siloed, decisions get made on incomplete information — which is why 68% of business leaders cite data silos as their top concern in 2025.
Security, Access Control, and Compliance
Enterprise data is sensitive. Effective BI platforms implement:
- Role-Based Access Control (RBAC): Following NIST SP 800-53 standards, RBAC enforces access based on defined user roles, ensuring people only inherit the privileges their job requires
- Encryption at rest and in transit to block unauthorized access to stored or moving data
- Compliance certifications — SOC 2 Type II and HIPAA are non-negotiable for regulated industries handling sensitive or protected health information
Recent vulnerabilities like LeakyLooker (nine cross-tenant flaws in Google Looker Studio) and Power BI spoofing exploits demonstrate that BI platforms are increasingly targeted by threat actors, making robust security architecture essential.
Types of BI Dashboards
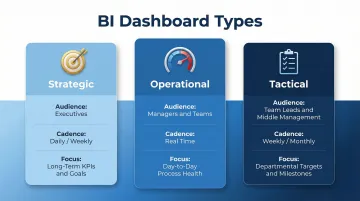
Strategic Dashboards
Strategic dashboards serve executives and senior leadership, displaying high-level KPIs aligned to long-term organizational goals—revenue growth, market share, annual targets, and strategic initiative progress. These dashboards typically update on a daily or weekly cadence rather than in real time, since strategic decisions operate on longer time horizons.
Walmart Finance standardized on Power BI to unify hundreds of billions of records into a semantic model for executive financial reporting, giving leadership a single source of truth for strategic planning.
Operational Dashboards
Operational dashboards monitor day-to-day business processes in real time. Managers and operational teams use them to identify bottlenecks, track performance against targets, and respond quickly to anomalies—order fulfillment rates, system uptime, customer support queue length, or manufacturing throughput.
Metro Bank, for instance, uses Power BI to automate financial reporting and monitor call center performance in real time—reducing manual data entry errors and enabling immediate response to service level deviations.
Tactical Dashboards
Tactical dashboards bridge strategic and operational views, focusing on departmental goals and short-term performance. Team leads and middle management use them to evaluate whether current activity is on track to meet broader strategic objectives—monthly sales targets, campaign performance, or product development milestones.
Netflix uses Power BI to analyze massive volumes of viewer interaction data, helping content teams decide which shows to promote or renew based on engagement trends.
Each dashboard type serves a different layer of the organization. Together, they ensure that leadership, managers, and frontline teams are all working from data matched to their decision-making horizon.
| Dashboard Type | Primary Audience | Update Cadence | Focus |
|---|---|---|---|
| Strategic | Executives | Daily / Weekly | Long-term KPIs & goals |
| Operational | Managers & teams | Real time | Day-to-day process health |
| Tactical | Team leads & middle management | Weekly / Monthly | Departmental targets & milestones |
Walmart Finance standardized on Power BI to unify hundreds of billions of records into a semantic model for executive financial reporting, giving leadership a single source of truth for strategic planning.
How to Design a BI Dashboard for Data Analysis
Step 1 — Define the Audience and Use Case
Before selecting a single metric, identify exactly who will use the dashboard and what decision it must support. A dashboard designed for everyone ends up useful to no one. Audience specificity shapes every design choice that follows.
Ask: Is this for executives monitoring strategic progress, managers tracking daily operations, or analysts exploring trends? What action should this dashboard enable? The answer determines everything from which KPIs to include to how frequently data should refresh.
Step 2 — Select Meaningful KPIs Over Vanity Metrics
Choose 5-10 high-signal metrics tied to outcomes the audience controls. Distinguish between leading and lagging indicators:
| Type | Definition | Examples |
|---|---|---|
| Lagging | Measures outcomes after they occur — tells you what happened | Revenue, churn rate, profit margin |
| Leading | Predicts future outcomes — enables proactive intervention | Pipeline coverage, activation rate, engagement score |
A balanced dashboard includes both. In practice, leading indicators should drive the majority of daily decisions.
Step 3 — Match Chart Types to Data and Intent
Use this framework:
- Line charts: Trends over time (revenue growth, user acquisition)
- Bar charts: Comparisons across categories (sales by region, product performance)
- Scorecards/KPI tiles: Single values requiring immediate attention (current month revenue, active users)
- Scatter plots: Correlations between two variables (marketing spend vs. conversions)
The Nielsen Norman Group explicitly warns against area-based graphs like pie charts, donut charts, and gauges. These visualizations rely on 2D area and angle, which humans process poorly and inaccurately. Instead, use linear graphs (bar and line charts) that leverage 2D position and length—pre-attentive attributes users can process instantly and accurately.
Step 4 — Design for Scannability
Visual hierarchy determines whether users extract insight in seconds or give up and ask someone. A few principles that make the difference:
- Place the most critical metrics at the top-left (where the eye naturally goes first)
- Use consistent color coding to indicate status (green for on-target, red for concerning, yellow for watch)
- Keep labels concise so users extract the core insight within seconds
- Break up dense information with white space and logical grouping
According to BARC research, dashboards fail when they lack proper training (50%), contain poor quality data (41%), or suffer from poor ease of use (33%). Scannability directly addresses the usability challenge.
Step 5 — Build in Interactivity and a Feedback Loop
Static dashboards become stale as business priorities evolve. Add:
- Date range filters for flexible time period analysis
- Segment toggles to compare performance across customer types, regions, or products
- Drill-down paths that let users investigate anomalies without filing new analyst requests
Establish a formal review cadence where users provide feedback to iterate on the dashboard as the business evolves. Teams that build this feedback loop into their process consistently get more value from their dashboards — and spend less time rebuilding them from scratch six months later.
How AI Is Transforming BI Dashboards
The Traditional BI Bottleneck
The conventional workflow creates severe delays: a business user needs an answer, submits a request to a data analyst, the analyst writes SQL, builds a chart, and returns results days later. The numbers tell the story:
- Data teams spend 70% of their time preparing data, leaving only 30% for actual analysis
- 76% of analysts still rely on manual spreadsheets for data prep, introducing errors that corrupt downstream analytics
- Approximately 80% of enterprise data remains unstructured, with less than 18% ever analyzed

The result: organizations become "data-rich but insight-poor" — sitting on vast amounts of information they can't act on fast enough.
Natural Language Querying
AI-powered BI tools allow any user to type a plain-English question—"What were my top 5 revenue-generating customers last quarter?"—and receive an instant, accurate answer with a visualization. This removes SQL as a barrier to data access, democratizing analytics across business teams.
By 2027, Gartner predicts that 50% of business decisions will be augmented or automated by AI agents, and 75% of new analytics content will be contextualized for intelligent applications through generative AI.
AI-Generated Dashboards
Modern AI tools can analyze a user's data sources and automatically generate entire dashboards—charts, layouts, and KPIs—instead of hours of manual configuration. Sylus exemplifies this approach, letting teams go from data source to a fully built, shareable dashboard in minutes by describing what they want in plain English.
The platform connects to 500+ data sources through one-click integrations and grounds all analysis in dbt models and documentation, ensuring governed context. Users can generate comprehensive KPI dashboards, sales performance analysis, or operational reports by simply asking questions about their data, eliminating the traditional dashboard-building workflow.
Governed AI for Trustworthy Analysis
Ungrounded AI analysis is risky—models can hallucinate metrics or use inconsistent business definitions. Despite the rush toward AI adoption, only 7% of enterprises say their organization's data is completely ready for AI.
The solution: grounding AI outputs in a verified semantic layer—such as dbt models and documentation—so that every metric the AI surfaces matches the organization's official definitions. Google reports that building with Looker's semantic layer reduces data errors in generative AI natural language queries by as much as two-thirds.
Frequently Asked Questions
What is a BI dashboard?
A BI dashboard is an interactive visual interface that consolidates data from multiple sources into a single view, displaying KPIs and metrics to help teams monitor performance and make faster, data-driven decisions.
What is a real-time dashboard?
A real-time dashboard updates its data continuously as new events occur, rather than on a scheduled refresh. This lets teams monitor live operations, spot anomalies immediately, and respond before small issues compound.
What should a dashboard look like?
A dashboard should be clean and uncluttered, prioritize the most critical metrics at the top, use consistent color coding, and be immediately scannable—so a user can extract the key takeaway within seconds of opening it.
What is the best BI tool for dashboards?
The best tool depends on the team's technical skill level, data stack, and use case. Traditional options include Tableau, Power BI, and Looker. AI-native platforms like Sylus suit teams that want to generate dashboards through natural language, with no SQL or dedicated analyst required.
What is the best tool for real-time dashboards?
The best tool for real-time dashboards combines fast data ingestion, live query capabilities, and an intuitive front end. AI-powered platforms stand out here—they surface real-time insights and flag anomalies automatically, so teams act on data as it arrives rather than after a report is manually assembled.