Introduction
Data teams face a persistent challenge: both "business intelligence" and "data analytics" appear constantly in job descriptions, vendor pitches, and strategy decks—often used interchangeably, as if they mean the same thing. This confusion has real consequences. Investing in the wrong tools or hiring the wrong expertise can leave organizations with dashboards nobody acts on, or analysis that never connects to business outcomes.
The distinction matters more than ever in 2025. Modern data stacks are evolving rapidly, and knowing whether your team needs descriptive reporting infrastructure, predictive analysis capabilities, or both shapes tooling decisions, headcount planning, and strategic direction.
The stakes are real: the global data and analytics software market reached $175.17 billion in 2024, growing 13.9% year-over-year. Yet despite this investment, between 60% and 73% of enterprise data goes unused for analytics. This guide breaks down exactly what separates BI from data analytics — covering definitions, use cases, tooling, and how to decide what your team actually needs.
Key Takeaways
- BI answers "what happened and what is happening now?" using dashboards and structured reports
- Data analytics asks "why did it happen and what might happen next?" using statistical methods and predictive modeling
- Operational monitoring and KPI tracking call for BI; uncovering root causes and forecasting trends calls for analytics
- Most mature organizations need both—the key is knowing which capability fits each decision
- AI-powered platforms now combine both capabilities, putting advanced analysis within reach of non-technical users
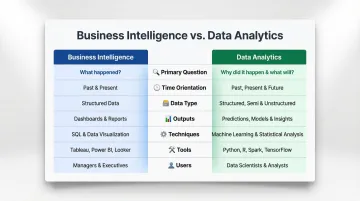
BI vs. Data Analytics: Quick Comparison
| Dimension | Business Intelligence | Data Analytics |
|---|---|---|
| Primary Question | What happened? What's happening now? | Why did it happen? What might happen next? |
| Time Orientation | Past and present | Future-focused |
| Data Type | Structured data (databases, warehouses) | Structured + unstructured (logs, text, images) |
| Typical Output | Dashboards, KPI scorecards, reports | Models, statistical findings, forecasts |
| Core Techniques | SQL queries, data visualization, aggregation | Statistical modeling, machine learning, hypothesis testing |
| Common Tools | Tableau, Power BI, Looker, Metabase | Python, R, SAS, Databricks, scikit-learn |
| Primary Users | Business managers, executives, operations teams | Data analysts, data scientists, researchers |
These categories aren't rigid — many full-stack analytics platforms blend both capabilities. In practice, a team might use BI to spot a revenue dip in a dashboard, then switch to data analytics to model the underlying cause and forecast recovery. Recognizing which approach fits the question at hand is what separates reactive reporting from proactive decision-making.
What is Business Intelligence?
Business Intelligence is an infrastructure-level capability for collecting, storing, and presenting structured data to support operational decision-making. IBM defines BI as "a set of technological processes for collecting, managing and analyzing organizational data to yield insights that inform business strategies and operations." BI's primary function is giving business users a reliable, repeatable view of what's currently happening across the organization—revenue trends, churn rates, inventory levels, performance against KPIs.
The Modern BI Stack
Modern BI relies on a modular, cloud-native architecture:
| Stack Layer | Function | Example Tools |
|---|---|---|
| Data Ingestion (ETL/ELT) | Extracts data from source systems and loads into centralized storage | Fivetran, Airbyte, Matillion |
| Cloud Data Warehouse | Centralized, queryable storage for structured data | Snowflake, BigQuery, Redshift |
| Semantic/Metrics Layer | Central hub where KPIs are defined once for consistency | dbt, LookML |
| Visualization/BI | Interface where users consume dashboards and insights | Tableau, Power BI, Looker |
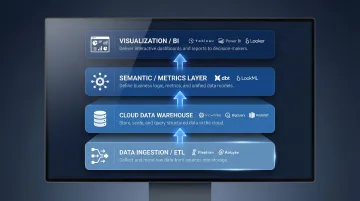
This modular approach allows enterprises to decouple storage from compute and define metrics centrally, preventing the "multiple versions of the truth" problem that plagued legacy systems.
BI's Descriptive Focus
BI focuses on descriptive analytics—summarizing historical and near-real-time data to surface trends, exceptions, and performance benchmarks. A simple example: a sales dashboard showing weekly revenue by region versus the prior period, with year-over-year comparisons and variance highlights.
Several mature platforms have emerged to deliver this capability. In the 2025 Gartner Magic Quadrant for Analytics and Business Intelligence Platforms, recognized Leaders include Microsoft (Power BI), Salesforce (Tableau), Google (Looker), and Qlik. Microsoft has maintained its Leader position for 18 consecutive years, while Tableau has been recognized as a Leader for 13 consecutive years.
Who Builds and Uses BI
BI systems are built and maintained by BI engineers and BI analysts—professionals with strong SQL skills, data modeling expertise, and deep business context understanding. They create dashboards that business users across the organization consume daily. A Qlik/Accenture survey found that 67% of the global workforce has access to BI tools, a sign of how embedded BI has become in day-to-day operations.
Use Cases of Business Intelligence
BI is most impactful when the question is already known and the answer needs reliable delivery at scale:
- Executive reporting: Weekly revenue reviews, quarterly performance summaries, board-level KPI tracking
- Operational monitoring: Real-time customer retention dashboards, supply chain performance metrics
- Compliance tracking: Regulatory reporting, audit trail documentation, P&L tracking
- Performance reviews: Sales rep scorecards, marketing campaign ROI, customer usage metrics
BI works best where the metrics are well-defined and consistency matters more than exploration. The moment the question shifts from "what happened?" to "why did it happen?"—that's where data analytics picks up.
What is Data Analytics?
Data analytics is a broader, more exploratory discipline that uses statistical methods, machine learning, and quantitative techniques to extract insights, identify patterns, and inform forward-looking decisions. SAS defines analytics as "a field of computer science that uses data and math to answer business questions, discover relationships and uncover new knowledge." Unlike BI, data analytics often starts with open-ended questions rather than pre-defined metrics.
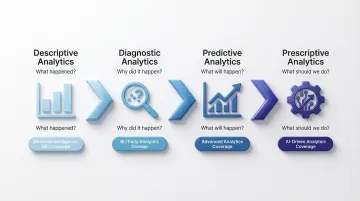
The Four Types of Analytics
The field is structured around four distinct methodologies:
Descriptive Analytics answers "what happened?" It summarizes past data using BI tools, dashboards, and data visualization to understand basic characteristics. This is where BI and data analytics overlap.
Diagnostic Analytics answers "why did it happen?" It uses data mining and drill-down capabilities to uncover correlations and root causes behind patterns observed in descriptive data.
Predictive Analytics answers "what will happen?" It uses historical data, statistical modeling, and machine learning to forecast future trends and probabilities.
Prescriptive Analytics answers "what should we do?" It uses optimization techniques and algorithms to recommend actionable next steps based on predictive insights.
BI primarily covers descriptive and some diagnostic analysis, while full data analytics spans all four types. Enterprise data maturity requires moving sequentially through these stages—combining predictive and prescriptive capabilities is the critical threshold for driving automated decisions at scale.
Tools and Methods
Data analytics requires stronger statistical and programming skills compared to BI. The toolchain is heavily standardized around open-source languages:
- Python: Used by 84.1% of data scientists according to Kaggle's 2023 survey
- SQL: Used by 51.5% of all developers per Stack Overflow's 2023 survey
- R: Used by 20.5% of data scientists, maintaining a strong foothold in statistical modeling
Additional tools include SAS, Databricks, machine learning libraries like scikit-learn, and platforms for data mining and experimental design.
Exploratory vs. Structured
What distinguishes data analytics from BI is its exploratory nature. A data analyst might not know what they'll find before they start. Their goal is discovery—finding patterns in customer behavior, correlating variables to explain churn, building models to predict demand.
Data analysts work primarily with raw, sometimes unstructured data—testing hypotheses and building models. BI analysts focus on making structured data accessible to business users. In most mature organizations, the two functions operate in parallel: BI handles the reporting layer while analytics drives deeper investigation.
Use Cases of Data Analytics
Data analytics is most valuable when the question itself is unclear or when past performance isn't enough:
- Churn prediction: Identifying which customers are at risk of leaving before they cancel
- Feature correlation: Discovering which product features correlate with retention and engagement
- Demand forecasting: Predicting quarterly demand to optimize inventory and production
- Recommendation engines: Building personalized product recommendations in e-commerce
- Fraud detection: Identifying suspicious transaction patterns in real-time
- Risk modeling: Assessing credit risk or investment portfolio risk in financial services
- A/B testing: Analyzing user behavior experiments to optimize product experiences
Industries where data analytics delivers the clearest results include e-commerce (basket analysis, recommendation engines), healthcare (predictive diagnostics), financial services (fraud detection, risk modeling), and technology (user behavior analysis, conversion optimization).
Key Differences Between BI and Data Analytics
The core distinction comes down to direction. BI is retrospective and operational — it tells you what is happening so you can manage the present. Data analytics is exploratory and forward-looking: it tells you why things are happening and what might happen next, so you can shape the future.
A concrete example makes this tangible:
| The Question Answered | |
|---|---|
| BI | Monthly churn rose 8% in Q3 |
| Data Analytics | Customers who skipped onboarding were 3x more likely to churn — and here's who's at risk next quarter |
Time Orientation
BI primarily operates on historical and real-time structured data to monitor performance. Dashboards show what happened yesterday, last week, or last quarter. Data analytics uses historical data as training material to build predictive models and uncover causality, projecting forward to estimate what will happen next month or next year.
Outputs and Audiences
BI produces dashboards, standardized reports, and KPI scorecards for business stakeholders who need regular, trusted answers. Executives, managers, and operations teams rely on these outputs for day-to-day decisions.
Data analytics produces models, statistical findings, and exploratory insights for decision-makers ready to act on nuanced recommendations. The audience is broader: product managers evaluating feature investments, marketing teams optimizing campaigns, and executives making strategic bets.
Skill Set Requirements
BI professionals need:
- Strong SQL skills for querying and transforming data
- Data modeling knowledge to design effective schemas
- Familiarity with business context and how metrics are defined
- Communication skills to translate data into business narratives
Data analytics professionals need:
- Statistical fluency and experimental design knowledge
- Programming skills in Python or R
- Machine learning familiarity for building predictive models
- Hypothesis testing and causal inference methods
The Blurring Boundary
The line between BI and data analytics is blurring in practice. Modern AI-powered analytics platforms are enabling conversational querying, automated pattern detection, and AI-generated summaries on top of traditional BI infrastructure. Forrester notes that "Generative AI is not replacing business intelligence; instead, it's leveling the playing field as all BI vendors integrate generative and agentic AI capabilities."
Microsoft has integrated Copilot into Power BI, allowing users to interact with data using natural language to generate DAX calculations and create visuals without writing code. Salesforce has introduced Agentic Analytics via Tableau Agent, processing over 11 trillion LLM tokens to empower AI agents to reason and execute tasks autonomously within BI workflows.
In practice, organizations no longer face a binary choice. The same platform can now deliver a weekly KPI dashboard and surface the predictive signal buried underneath it.
When to Use BI, Data Analytics, or Both
Choose BI when your primary need is consistent operational visibility. Your metrics are defined, your audience is business users, and the goal is monitoring and accountability. BI excels when you need reliable answers to known questions delivered on a schedule.
Choose data analytics when you need to investigate root causes, test hypotheses, or build predictive models. Analytics is the right choice when you're exploring new territory, validating assumptions, or forecasting future scenarios.
Invest in both when your organization is scaling and needs reliable performance tracking alongside the ability to discover new growth levers. Most mature organizations require both capabilities working in tandem.
Real-World Combined Approach
AMN Healthcare combined Snowflake's data lake architecture with Microsoft Power BI to achieve measurable outcomes. The company managed up to 25,000 healthcare professionals on assignment but struggled with a complex, costly data architecture that caused reporting delays and resource contention, costing $2.4 million annually.
By pairing advanced data infrastructure (Snowflake) with enterprise BI (Power BI), AMN Healthcare built a unified, consistent data layer and delivered real-time dashboards to sales leaders and operations teams. The results were concrete:
- Data environment costs dropped from $200,000/month to $14,000/month — a 93% reduction and $2.2 million in annual savings
- Data warehouse runtime cut by 75%
- Pipeline success rate reached 99.9%
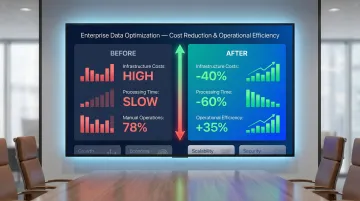
Neither discipline alone produced this outcome. The value came from applying each to the right problem: BI to monitor operational metrics, analytics to optimize the underlying data infrastructure.
AI-Powered Platforms Bridging Both
Sylus gives teams access to both capabilities within a single platform. It grounds all analysis in governed context — your dbt models and documentation — so business users can ask plain-English questions and get BI-style answers without waiting on analysts.
For deeper work, Sylus supports exploratory analysis and assumption testing that would typically require a dedicated analyst. Automated dashboard generation handles operational monitoring; conversational AI handles the investigation — both governed by the same data standards.
Conclusion
BI and data analytics are not competing disciplines—they serve different but complementary purposes. BI gives organizations the operational visibility they need to run the business today. Data analytics gives them the insight to build the business of tomorrow. Choosing between them isn't a strategic debate—it's a tactical one. The right answer depends on whether you're monitoring what's happening or investigating why it happened.
That distinction matters more as AI enters the data stack. Modern platforms increasingly handle both descriptive reporting and predictive modeling in a single workflow, which makes it tempting to treat BI and analytics as interchangeable. Organizations that hold onto the foundational differences will adopt these tools intentionally—matching the right capability to the right problem—rather than deploying AI broadly and hoping for returns. That intentionality is what separates teams that extract value from their data from those contributing to the 60-73% of enterprise data that goes unused.
Frequently Asked Questions
Is business intelligence a part of data analytics?
This depends on how broadly "data analytics" is defined. In many frameworks, BI is considered a subset of data analytics focused on descriptive analysis, while data analytics encompasses the full spectrum including diagnostic, predictive, and prescriptive methods. BI handles the descriptive layer; data analytics extends further into prediction and prescription.
What are the 4 types of data analysis?
The four types are descriptive (what happened), diagnostic (why it happened), predictive (what might happen), and prescriptive (what action to take). BI primarily covers descriptive and some diagnostic analysis, while full data analytics spans all four types, with predictive and prescriptive representing the most advanced capabilities.
Which is better: business intelligence or business analytics?
Neither is universally better. BI is better for operational monitoring and standardized reporting where metrics are well-defined. Business analytics (a form of data analytics) is better for forecasting and strategic planning where exploration and prediction are needed. Most organizations benefit from both working together.
Which is better: business intelligence analyst or data analyst?
The answer depends on organizational needs and career goals. BI analysts excel at delivering consistent dashboards and reports, requiring strong business context and communication skills. Data analysts are better suited for exploratory analysis, statistical modeling, and pattern discovery, requiring programming and statistical depth.
What is the salary of a data analyst compared to a business intelligence analyst?
According to Glassdoor data from March 2026, Business Intelligence Analysts earn a median total pay of $116,376 (base range $78K–$118K), while Data Analysts earn $93,028 (base range $59K–$98K). The roughly $23,000 gap reflects the broader skill set BI roles require — blending technical data work with business communication.
Is a business intelligence analyst the same as a business analyst?
No. A BI analyst focuses on data infrastructure, dashboards, and SQL-driven reporting to make data accessible through visualizations and KPIs. A business analyst works on process improvement, requirements gathering, and bridging technical teams with business stakeholders. The roles can overlap in smaller organizations but represent distinct skill sets.