Introduction
Organizations have more data than ever before — yet most business users still can't get answers without filing a request to a data team or waiting days for a custom dashboard.
Companies accumulate terabytes of information across CRMs, ERPs, databases, and analytics platforms, but 68% of enterprise dashboards go unused within six months of deployment, and 70-80% of enterprise data remains entirely untapped.
The gap between data availability and data usability has become the defining constraint on data-driven decision-making. When a sales manager asks a follow-up question like "why did that region drop?" or "which customer segment drove it?" traditional BI tools can't adapt. Users export to spreadsheets, file tickets with data teams, and wait.
This article covers why traditional BI has hit a structural wall, how AI is changing what's possible for business users, the specific capabilities driving that shift, and what to look for when evaluating AI-powered tools.
Why Traditional BI Has Hit a Wall
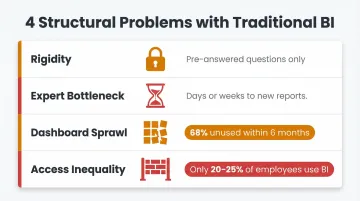
The Rigidity Problem
Traditional BI tools are built around pre-answered questions. Dashboards excel at showing what happened—last quarter's revenue, this month's customer count—but when a business user asks a natural follow-up, the tool can't adapt. The dashboard displays a metric, but it can't explain why that number dropped or which segment drove the change.
Users end up exporting data to spreadsheets to perform their own analysis, defeating the purpose of the BI investment. This rigidity stems from BI's fundamental architecture: dashboards are static artifacts built by technical teams, not dynamic interfaces that respond to evolving business questions.
The Expert Bottleneck
Getting a new dashboard or custom report typically involves submitting a request to a BI or data team, waiting for scoping, development, and review—a cycle that can take days or weeks. Organizations using AI-driven analytics platforms achieved up to 40% faster insight delivery compared to traditional BI architectures, highlighting just how slow the conventional process has become.
By the time the answer arrives, the decision moment may have passed. Markets shift and competitive windows close — often before the data team finishes building the report.
Dashboard Sprawl and Fragmented Truth
Organizations accumulate hundreds of dashboards as each team builds its own version of the truth. Finance defines "revenue" one way, Sales defines it another, and Marketing uses a third definition entirely. This fragmentation creates low-trust data environments where stakeholders question which dashboard to believe.
The abandonment metrics are damning: 68% of dashboards go unused within six months of deployment, accumulating as technical debt and compounding maintenance costs.
Access Inequality
BI tools traditionally required SQL proficiency or BI platform training, putting data access firmly in the hands of technical users. Business stakeholders remain dependent on intermediaries for even simple queries. Key adoption figures tell the story:
- Only 20–25% of employees actively use BI tools — a figure flat for a decade, according to Gartner
- Nearly half of business leaders admit they can't fully utilize their dashboards due to tool or data complexity
The Structural Reality
These are structural problems, not surface-level UI issues. Traditional BI was designed for a small set of analysts answering pre-defined questions — not for an organization where every business user needs answers on demand. Better interfaces don't fix that.
How AI Is Transforming Business Intelligence
Natural Language as the New Interface
Natural language processing (NLP) allows business users to ask questions in plain English and receive answers backed by real data—no SQL, no BI developer needed. This fundamentally shifts who can access BI from trained analysts to anyone in the organization.
The conversational capability is what makes this transformation meaningful. Users can ask "why?" after an initial result, and the system adapts. They can explore data iteratively, following their curiosity without hitting technical walls or needing to file new requests.
Grounded Analysis, Not Generic Interpretation
AI-native BI tools don't just translate natural language to SQL. The best ones ground their analysis in the organization's specific data context: how fields are defined, how metrics are calculated, and what business rules apply.
Sylus builds on governed context using dbt models and documentation so the AI analyst understands what "churn," "revenue," or "active user" actually means for that specific business. This makes analysis trustworthy, not just fast. The numbers back it up: integrating a semantic layer boosts Text-to-SQL accuracy to 92.5%, and dbt Labs found that AI answered 83% of addressable natural language questions correctly when routed through the dbt Semantic Layer.
From Descriptive to Predictive: Expanding What BI Can Answer
Traditional BI answers one question: what happened? AI-powered BI expands that scope across the full analytics spectrum—from diagnosing root causes and forecasting trends to recommending next actions—without requiring a dedicated data science team for each question.
Machine learning models embedded in AI BI tools can surface anomalies, forecast trends, and flag risks proactively, shifting BI from a reactive reporting function to a forward-looking decision support system. The predictive analytics market is projected to grow at a 21.7% CAGR from 2021 to 2026, reaching $28.1 billion, and Gartner predicts that by 2027, 50% of business decisions will be augmented or automated by AI agents.
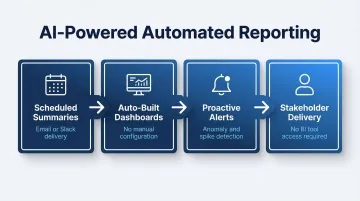
Automated Reporting and Dashboard Generation
AI can generate entire dashboards, summaries, and reports automatically—cutting the manual work of building and maintaining visualizations. Data teams spend less time on recurring reporting tasks and more on the analysis that actually shapes decisions.
Key automation capabilities include:
- Schedules AI-generated summaries for delivery via email or Slack
- Builds and updates dashboards without manual configuration
- Delivers proactive alerts when metrics spike or anomalies appear
- Keeps stakeholders informed without requiring BI tool access
This closes the loop between data availability and data consumption—insights reach decision-makers on their schedule, not the analyst's.
Key AI Capabilities Reshaping BI
Modern AI brings several distinct capabilities to business intelligence—each addressing a gap that traditional BI tools leave open. Here's what those capabilities actually look like in practice.
Automated Insight Detection
AI continuously monitors data and surfaces statistically significant changes, spikes, or anomalies—alerting relevant stakeholders before they would have noticed something was wrong. Traditional BI requires someone to know what to look for. AI BI proactively surfaces what matters.
Self-Service Analytics
AI lowers the technical floor for data access so that business users—not just analysts—can explore, query, and visualize data independently. This shifts who can generate insights, putting analysis in the hands of the people closest to the business problems.
Data Validation and Assumption Checking
Strong AI BI tools explore the data, test assumptions, and check for inconsistencies before returning a result—rather than returning the first plausible answer. This is what separates trustworthy AI BI from a "fast but wrong" shortcut.
Unstructured Data Analysis
AI can process and extract insights from unstructured sources that traditional BI tools cannot touch:
- Customer emails and support transcripts
- Survey responses and product feedback
- Internal documents and meeting notes
NLP enables sentiment analysis and topic extraction from these sources, expanding what "business intelligence" can actually cover.
Cross-Source Analysis
AI BI tools can query and synthesize data across multiple connected sources simultaneously—giving users a unified view without manual data joins or pre-built pipelines for every question. This breaks down data silos and makes holistic analysis possible without involving an engineer every time.
Real Business Impact: What Changes When AI Runs Your BI
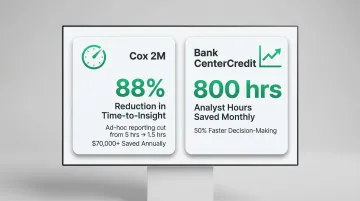
Speed-to-Insight Shift
Business users getting answers in seconds—not days—make decisions more often and with more confidence. Cox 2M achieved an 88% reduction in time to insights using ThoughtSpot, cutting ad-hoc reporting from 5 hours to 1.5 hours and saving over $70,000 annually. Bank CenterCredit saves 800 analyst hours monthly and accelerated decision-making by 50%.
That kind of speed changes how organizations respond to market shifts, not just how fast they pull reports.
Democratization Impact
When BI is no longer gated by technical skill, organizations see broader data engagement—more teams asking questions, more data influencing decisions, and fewer decisions made on gut instinct. Companies with successful self-service BI reduce IT bottlenecks by 70% while improving decision speed by 5x.
This organizational culture shift enables data literacy across departments, not just within analytics teams. When everyone can access and interpret data, the entire organization becomes more responsive and evidence-driven.
Data Team Impact
AI BI doesn't replace data teams—it redirects their effort toward higher-value work. In practice, that shift looks like:
- Less time fielding recurring report requests; more time on complex modeling
- Moving from bottleneck to enabler of self-service analytics
- Deeper focus on data governance, infrastructure, and strategic analysis
- Ownership of the data quality and context that makes AI outputs trustworthy
What to Look for in an AI-Powered BI Tool
Governed Context and Data Trust
An AI BI tool is only as reliable as the context it operates within. Look for tools that ground analysis in your organization's actual data definitions—ideally integrated with semantic layers or data documentation tools (like dbt)—rather than making generic inferences.
Without this, even a sophisticated AI can return plausible-sounding but incorrect results. Google Looker internal testing showed that LookML reduces data errors in generative AI natural language queries by as much as two-thirds.
Security, Compliance, and Deployment Flexibility
Enterprise BI involves sensitive data. When evaluating a tool, confirm it covers the basics your security team will ask about:
- SOC 2 Type II certified and HIPAA compliant (if your industry requires it)
- Self-hosted deployment option for teams that can't route data through third-party cloud environments
- A clear policy against training models on your data — enterprises increasingly require this to protect intellectual property and confidential information

Sylus is built with these requirements in mind: SOC 2 Type II and HIPAA compliant, with self-hosted deployment available and no model training on customer data.
Ease of Integration and Scalability
Look for tools that connect to your existing data sources and scale with your team—not tools that require lengthy IT projects to get started. On pricing: per-seat models can quietly become a barrier to the broad adoption that makes AI BI worth investing in. Usage-based pricing tends to support wider access across teams.
Frequently Asked Questions
How is AI used in business intelligence?
AI is used in BI to enable natural language querying, automate report and dashboard generation, surface predictive insights, detect anomalies, and allow non-technical users to analyze data without writing SQL—effectively expanding who can access and act on data.
Is business intelligence part of artificial intelligence?
BI and AI are distinct but increasingly overlapping disciplines. Traditional BI describes and reports past performance; AI adds prediction, automation, and natural language understanding. Today's BI platforms embed both, making the boundary between them largely academic.
What are the 4 main types of AI?
The commonly cited four types are reactive machines, limited memory, theory of mind, and self-aware AI. In the BI context, "limited memory" AI—which learns from historical data to make predictions—is the most relevant category for analytics use cases.
What is the difference between traditional BI and AI-powered BI?
The core difference is in who can use it. Traditional BI requires technical expertise to build or modify reports. AI-powered BI lets anyone ask questions in plain English and get answers without touching SQL or a data model.
Can non-technical users benefit from AI in BI?
Yes. AI-powered BI is specifically designed to extend data access beyond technical users—business stakeholders can ask questions in plain English, receive validated answers, and explore follow-up queries without writing SQL or knowing how the underlying data model is structured.