Introduction
For years, embedded analytics has followed a predictable pattern: pre-built dashboards, static charts, and a hard assumption that users either know how to read data or don't need to. Business users log in, scroll through pre-configured reports, and either find what they need or file a ticket with the data team. The experience has been unchanged since the second generation of BI tools introduced drill-downs and filters a decade ago.
Generative AI breaks that assumption entirely. Instead of forcing users to learn the tool's language—queries, dimensions, filters—the tool learns theirs. The interface becomes a question, not a configuration panel.
Not all AI-powered analytics platforms are created equal, though. The market is flooded with products that layered a chatbot on top of a legacy BI stack and called it "AI-native." This post explains the difference between AI-washed embedded analytics and genuinely AI-native platforms—and what to watch for when evaluating vendors.
TLDR:
- Generative AI shifts embedded analytics from passive dashboard consumption to active, conversational data exploration
- The most valuable capabilities include on-demand chart generation, automated narrative insights, proactive alerting, and non-linear exploration
- Governance and trust aren't optional—they're the foundation that makes GenAI analytics reliable enough to act on
- AI-native platforms are built around language and governed context from the start, not retrofitted onto traditional BI stacks
- When evaluating platforms, ask whether the AI is grounded in your data model, respects access controls, and explains its outputs
The Evolution of Embedded Analytics: From Static Reports to AI-Native Experiences
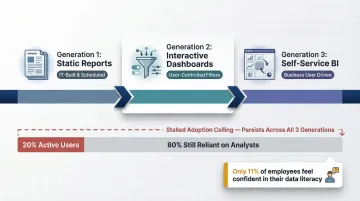
The arc of business intelligence has moved through distinct generations. First-generation embedded analytics was about embedding static reports into portals—IT teams built what executives needed, and users consumed it. Second-generation tools introduced interactive dashboards with filters and drill-downs, giving users some control over what they saw. The third wave, self-service BI, promised to let business users build their own views using drag-and-drop chart builders and visual query tools.
Each generation hit the same ceiling: adoption flatlined at 20% of business users a decade ago and hasn't moved since, leaving 80% of users still reliant on data analysts. The reason is simple—these tools still required significant data literacy. Only 11% of global employees feel fully confident in their data literacy skills, which means self-service BI never reached the audience it was designed for.
Generative AI changes the fundamental dynamic. Instead of asking users to learn the tool's language, the tool learns theirs. Users express intent in plain English, and the system generates the appropriate output—chart, dashboard, or narrative insight. This is especially significant for embedded analytics, where the end user is often a customer of a SaaS product, not a trained data professional.
That opportunity attracted a wave of vendors—and most took the path of least resistance. The race to "add AI" in 2023–2024 produced a market full of products that layered a natural language interface onto unchanged backend architectures. Gartner estimates that of thousands of vendors claiming agentic AI capabilities, only about 130 are real. The difference between AI-washed and AI-native platforms comes down to architecture: platforms built with generative AI at the center design their data model, query engine, and output layer around it from the start—not as a feature added later.
What Generative AI Actually Changes About Embedded Analytics
From Synchronous to Dynamic Interaction
Traditional embedded analytics is synchronous and pre-defined. A developer builds what users can see, and users consume it. Generative AI makes the interaction dynamic—users express intent, and the system generates the appropriate output. This matters at scale because product teams no longer need to anticipate every possible question a user might have.
Consider a logistics company's operations manager who notices a spike in delivery times. In a traditional embedded analytics setup, they'd need a pre-built drill-down path to explore root cause — filtering by region, carrier, package type, or time window. If that path doesn't exist, they file a data request and wait.
In a generative AI model, they ask a follow-up question, pivot to a new dimension, or explore an anomaly — all within a single session, without a developer involved.
Context-Grounded Generation: The Semantic Layer Imperative
For GenAI analytics to produce trustworthy outputs, the model needs to understand what the data means, not just its raw values. Semantic layers and data documentation are what make that possible — they ground every AI-generated analysis in verified business definitions.
Gartner predicts that by 2030, universal semantic layers will be treated as critical infrastructure, on par with data platforms and cybersecurity. Without that governed context layer — such as dbt models with documented metrics and definitions — language models hallucinate business logic. They might calculate "revenue" using the wrong table join or misinterpret a dimension because the column name is ambiguous.
Platforms that ground AI outputs in a semantic layer can answer questions correctly. In a dbt Labs replication, AI answered 83% of addressable natural language questions correctly when routed through a semantic layer. Without it, accuracy plummets.
The Agentic Shift: From Reactive to Proactive
Modern GenAI analytics platforms don't just respond to queries — they can proactively surface insights, monitor for anomalies, and push findings to users before they even ask. This moves analytics from a reactive tool to a proactive assistant embedded in the user's workflow.
Agentic platforms monitor metrics continuously and push alerts to email or Slack when something meaningful changes. Gartner predicts that 40% of enterprise applications will be integrated with task-specific AI agents by the end of 2026, up from less than 5% in 2025.
Democratization—This Time for Real
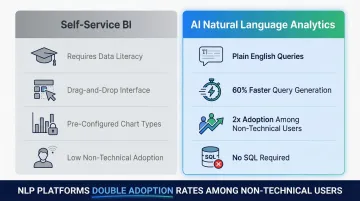
The promise of "anyone can use data" has been made before. Self-service BI made the same claim. What's different this time? The barrier isn't skill — it's interface. Natural language is a genuinely universal interface in a way that drag-and-drop chart builders never were.
NLP-enabled BI platforms can reduce query generation time by up to 60% and double adoption rates among non-technical users. The gap between users who need data insights and those who can independently access them is finally closing. The interface changed — and that's what self-service BI could never do on its own.
The Capabilities That Define Genuinely AI-Native Embedded Analytics
On-Demand Chart and Dashboard Generation
Users describe what they want to see, and the system generates the visualization—chart type, axes, time range, and filters selected by the AI based on intent. This is architecturally different from letting users pick from a library of pre-built charts.
In a traditional embedded analytics setup, a developer must anticipate which chart types users might need and pre-configure them. In an AI-native platform, the system interprets the user's question and selects the appropriate visualization format.
A user asking "show me revenue by region over the last quarter" receives a bar chart or line graph with the correct axes and time range, without configuring anything.
This matters for user adoption in embedded products because it eliminates the learning curve. Users don't need to understand which chart type is appropriate for trend analysis versus comparison—the AI makes that decision based on the data and the question.
Automated Narrative and Insight Generation
Numbers on a screen don't tell a story. Generative AI can produce plain-language summaries alongside visualizations that explain what the data shows, what's notable, and what might have caused it.
For non-analyst users who need actionable conclusions, not raw data, this capability closes a critical gap. Instead of looking at a spike in churn and wondering what it means, they receive a summary: "Churn increased 18% in Q3, concentrated in the Pro plan tier. The spike began in mid-August, coinciding with a pricing change announcement."
The product stops being a reporting layer and becomes something closer to an analyst on call.
Proactive Alerting and Scheduled Intelligence
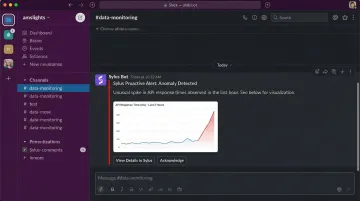
AI-native platforms can monitor metrics and send alerts when there are meaningful spikes or anomalies—pushed to email or Slack rather than requiring users to log in and check. Users stay informed without changing their workflow.
Platforms like Sylus enable alert-based notifications alongside scheduled AI-generated summaries delivered to email or Slack. Sylus also supports querying data directly from Slack, so users can ask "@sylus show me my top customers" and receive instant visualizations without leaving their chat interface.
Non-Linear, Conversational Exploration
Unlike traditional dashboards where every drill-down path is pre-engineered, conversational analytics lets users follow threads organically. A user asking "why did churn spike in Q3?" can immediately follow up with "was it concentrated in a specific plan tier?" or "did customer support tickets increase during that period?"—without any pre-built filter logic.
Embedded analytics serves highly varied end users with unpredictable analytical needs. A SaaS product can't pre-engineer every exploration path for every persona—marketing, finance, operations, and beyond. Conversational analytics removes that constraint entirely.
Shareable Outputs and Collaboration
AI-generated dashboards and insights should be shareable—via link, email, or embedded directly into the product experience—and should support team collaboration to verify metric definitions and ensure shared understanding of what numbers mean.
The business case for getting this right is concrete. Businesses using embedded analytics experienced a 20% increase in customer retention and a 30% rise in revenue. Separately, Amplitude's 2025 Product Benchmark Report found that users in the top quartile of activation are also in the top quartile of retention. Analytics adoption in SaaS products correlates directly with product stickiness.
The Trust Layer: Governance, Hallucinations, and Security in GenAI Analytics
The Hallucination Problem
Language models are trained to generate plausible outputs, not necessarily accurate ones. In an analytics context, a hallucinated revenue figure or a fabricated trend line isn't a minor inconvenience—it's a business risk.
Independent mathematical proofs have demonstrated that eliminating hallucination in large language models is impossible, as any system generating text by predicting probable sequences from learned statistical distributions will inevitably produce outputs not grounded in fact. Google DeepMind's FACTS Benchmark Suite revealed that all evaluated leading models achieved an overall accuracy below 70%.
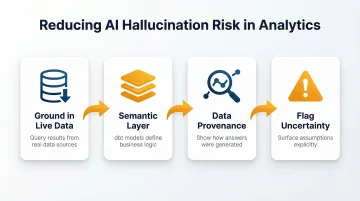
Reducing hallucination risk requires deliberate architectural choices:
- Ground outputs in actual query results against live data
- Use a semantic layer (such as dbt models) to define business logic
- Show data provenance so users can verify how an answer was generated
- Flag uncertainty when interpretations involve assumptions
According to McKinsey's 2025 Global Survey on AI, 51% of respondents from organizations using AI report seeing at least one instance of a negative consequence, with nearly one-third reporting consequences stemming from AI inaccuracy.
Governance: Access Control in a Natural Language World
When users can ask any question in natural language, traditional access control models—which were built around pre-defined report permissions—need to be rethought. A well-governed GenAI analytics platform enforces row-level and column-level security dynamically, so a sales rep querying data in natural language cannot inadvertently surface HR or financial data they shouldn't see.
Governed context—such as dbt model documentation that defines metrics, dimensions, and access rules—is the mechanism that grounds AI behavior in business-defined rules. Platforms like Sylus ground all analysis and exploration in dbt models and dbt documentation, ensuring the AI understands what business terms mean and operates within defined data access rules rather than making assumptions.
Modern data warehouses support this through native security features:
- Row-Level Security (RLS): Snowflake supports RLS through row access policies that determine which rows to return in a query result
- Column-Level Security (CLS): Databricks Unity Catalog utilizes column masks to control what values users see in specific columns
By enforcing RLS and CLS directly in the cloud data warehouse, AI agents querying the semantic layer inherently respect tenant isolation and user permissions, preventing cross-tenant data leakage.
Enterprise Security and Compliance
For companies in regulated industries or with enterprise customers, data privacy guarantees are non-negotiable. Key questions include:
- Does the provider train models on customer data?
- Is the deployment model flexible (cloud vs. self-hosted)?
- What certifications does the platform carry?
Sylus is SOC 2 Type II and HIPAA compliant, offers self-hosted deployment, and neither Sylus nor its model partners train on customer data—the properties that typically determine whether regulated enterprises can adopt AI analytics at all.
Explainability as a Trust-Building Feature
Users need to understand where an AI-generated answer came from to trust it enough to act on it. Platforms that do this well show the underlying query that generated a chart, identify the data source and time range, and flag when an interpretation involves assumptions.
Black-box AI answers erode confidence over time and increase the risk of misuse. Platforms that encourage users to ask "how did you get this?" and provide transparent explanations make it possible for teams to verify metric definitions collaboratively—turning AI-generated answers into something defensible, not just convenient.

What to Look for When Evaluating an AI-Native Embedded Analytics Platform
The Architecture Test
Is the AI a layer on top of a traditional BI engine, or is the platform built around language-first querying from the start? Ask whether the platform has a governed semantic layer, whether AI outputs are derived from actual queries against live data, and whether the system can explain how it arrived at an answer.
Platforms that fail this test will struggle with accuracy and governance at scale. While legacy academic benchmarks like Spider 1.0 boast 85–92% execution accuracy for Text-to-SQL, recent analyses of enterprise-grade datasets reveal annotation error rates of 52.8% to 66.1%. High academic benchmark scores do not translate to production SaaS environments without a governed semantic layer.
Integration and Deployment Flexibility
Before committing to a platform, verify it can fit into your existing stack without forcing a rebuild. Key integration criteria include:
- Connects to your existing data sources and warehouses
- Supports dbt-defined metrics and documentation as the semantic layer
- Embeds into your product experience via link, iframe, or API — not just as a standalone tool
- Offers both cloud and self-hosted deployment for data residency requirements
- Provides air-gapped deployment options for regulated industries
Scalability and Commercial Model
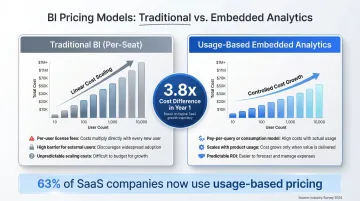
Analytics platforms that charge per seat create friction for embedded use cases—where the goal is to give every customer access to data insights, not just a designated analyst. Look for platforms that price based on usage rather than seats, so that adoption can scale without a linear increase in cost.
63% of SaaS companies now have some form of usage-based pricing, driven by the high compute costs of AI inference. Purpose-built embedded analytics platforms with usage-based or flat-rate pricing can offer a 3.8x cost difference in Year 1 compared to traditional BI licensing.
Pricing model aside, the end-user experience matters equally. Evaluate whether non-technical users can onboard without engineering support, and whether the platform covers the collaboration workflows your team actually needs:
- Commenting and verification workflows for shared analyses
- Shareable outputs via link, email, or embedded content
- Scheduled reports and alerts for ongoing monitoring
Frequently Asked Questions
What is the difference between traditional embedded analytics and generative AI embedded analytics?
Traditional embedded analytics delivers pre-built, static dashboards that users consume passively. Generative AI embedded analytics lets users ask questions in plain English and receive dynamically generated charts, dashboards, and narrative insights in real time—no developer pre-configuration required for every possible view.
How does generative AI avoid hallucinations in analytics outputs?
Reliable platforms ground AI outputs in actual query results against live data, use a semantic layer (such as dbt models) to define business logic, and show data provenance so users can verify how an answer was generated. Platforms that skip these architectural choices produce unreliable outputs that cannot be trusted for decision-making.
Can non-technical users really use AI-powered embedded analytics without knowing SQL?
Yes. Natural language querying removes the SQL barrier entirely—users describe what they want in plain English, and the platform handles query generation, chart selection, and result interpretation automatically. This shift drives meaningful adoption gains among non-technical users who previously depended on analysts for every data request.
What is "governed context" in AI-powered analytics, and why does it matter?
Governed context refers to grounding all AI analysis in a defined semantic layer—such as dbt models with documented metric definitions—so that the AI understands what business terms mean and operates within defined data access rules rather than making assumptions. Without governed context, AI models hallucinate business logic and produce unreliable outputs.
How do I tell whether an embedded analytics platform is truly AI-native or just AI-washed?
AI-native platforms are built around language-first querying, governed context, and explainable outputs from the ground up. AI-washed platforms bolt a chat interface onto an unchanged traditional BI engine. Test by asking: Does the AI ground outputs in a semantic layer? Can it explain how it arrived at an answer? Does it enforce access controls dynamically?
Is AI-powered embedded analytics secure enough for enterprise or regulated industry use?
Look for SOC 2 and HIPAA compliance, a firm no-training-on-customer-data policy, row- and column-level access controls, and self-hosted deployment options. Also verify the platform enforces security at the data warehouse level and maintains audit trails for AI-generated outputs.