For e-commerce and D2C brands

E-commerce analytics that answers in plain English

Sylus is a self-learning AI data analyst for online brands. Connect your store, marketplaces and ad accounts, ask about sales, margin and ROAS, and get answers and dashboards in minutes.

Trusted by fast-growing COMPANIES

Sylus AI
Insights at the speed of thought

The Old Way

The Old Way

What getting answers from your e-commerce data probably looks like right now

Every Monday someone exports orders from Shopify, Amazon and the ad platforms and pastes them into Excel before anyone can see how the week went.

Your store, ad platforms and analytics never agree, so every growth meeting starts with an argument about whose revenue and ROAS numbers are right.

You find out a campaign stopped converting or a best-seller went out of stock after the money is already spent.

Your growth and finance teams spend their days pulling reports instead of deciding where to spend the next dollar.

Chat with your AI data analyst

Get the answers you need in seconds.

Ask a question, get back answers.

Ask a question or type ‘/’ for shortcuts…

Sales Database

Chat with your AI data analyst

Get the answers you need in seconds.

Ask a question, get back answers.

Ask a question or type ‘/’ for shortcuts…

Sales Database

Chat with your AI data analyst

Get the answers you need in seconds.

Ask a question, get back answers.

Ask a question or type ‘/’ for shortcuts…

Sales Database

The Sylus Way

The Sylus Way

What getting answers from your e-commerce data should feel like

Ask, don’t export. Type “Which campaigns drove the most revenue this week?” and get the answer in seconds. No SQL, no tickets, no spreadsheets.

Every channel, one view. Sylus connects your online store, marketplaces, ad platforms, payments and accounting, so revenue, margin and ad spend finally line up.

Know before the week ends. Get a daily sales report in your inbox or Slack, and an alert when revenue, conversion or ROAS spikes or drops.

Your team decides instead of pulling data. Founders, growth, merchandising and finance get their own answers and spend their time on what to scale, restock or fix.

From question to answer in seconds.

From question to answer in seconds.

See Sylus answer questions on your own store data. Book a 15-minute demo or get a call back.

Questions you can ask Sylus

Questions you can ask Sylus

Ask in plain English and get an answer, a chart or a full dashboard. A few examples:

Revenue

“What was revenue by channel and country last week?”

Average order value

“What’s our average order value by channel this month?”

Conversion

“How did conversion rate change by device this month?”

Product margin

“What are our top 20 products by gross margin after discounts?”

Ad spend

“Which campaigns had the best ROAS last month?”

Inventory

“Which best-sellers will run out of stock in the next 14 days?”

Repeat customers

“What share of first-time customers ordered again within 90 days?”

Returns

“Which products have the highest return rate?”

Turn any question into a report that lands in your inbox or Slack daily, weekly or monthly, and get an alert when a metric spikes or drops.

Build an e-commerce dashboard with a single prompt

Build an e-commerce dashboard with a single prompt

Describe what you want to track, like revenue by channel, ROAS by campaign or stock by product, and Sylus builds the dashboard in minutes.


Home

Feedback

Good afternoon, Erlich Bachman.

How can I help you today?

Home

Feedback

Good afternoon, Erlich Bachman.

How can I help you today?

Weekly online sales digest
Next: Monday · 9:00 AM
Emailecommerce-teamAI summary
Alert · just nowSylus
Mobile conversion dropped 18% vs. last Tuesday.
18%
See what changed→

Reports on autopilot

Send reports and AI-written summaries to email or Slack on your schedule. Get an alert the moment a metric spikes or drops.


Weekly online sales digest
Next: Monday · 9:00 AM
Emailecommerce-teamAI summary
Alert · just nowSylus
Mobile conversion dropped 18% vs. last Tuesday.
18%
See what changed→

Reports on autopilot

Send reports and AI-written summaries to email or Slack on your schedule. Get an alert the moment a metric spikes or drops.


Weekly online sales digest
Next: Monday · 9:00 AM
Emailecommerce-teamAI summary
Alert · just nowSylus
Mobile conversion dropped 18% vs. last Tuesday.
18%
See what changed→

Reports on autopilot

Send reports and AI-written summaries to email or Slack on your schedule. Get an alert the moment a metric spikes or drops.


Save changes

Copilot

SQL

Which channel has the highest AOV?

Analysis Steps

Search definitions…
Net revenue
Conversion rate
Verified definition
Return rate %Draft
ROAS

Answers you can trust

Save your team’s approved metric definitions in one catalog. Sylus answers from them first, so everyone gets the same reliable numbers every time.

Save changes

Copilot

SQL

Which channel has the highest AOV?

Analysis Steps

Search definitions…
Net revenue
Conversion rate
Verified definition
Return rate %Draft
ROAS

Answers you can trust

Save your team’s approved metric definitions in one catalog. Sylus answers from them first, so everyone gets the same reliable numbers every time.

Save changes

Copilot

SQL

Which channel has the highest AOV?

Analysis Steps

Search definitions…
Net revenue
Conversion rate
Verified definition
Return rate %Draft
ROAS

Answers you can trust

Save your team’s approved metric definitions in one catalog. Sylus answers from them first, so everyone gets the same reliable numbers every time.

NA
Noura Al Ali
Head of E-commerce
TB
Tom Becker
Performance Marketing
MC
Mei Chen
Customer Service

Share, embed, or export

Share with a link or email invite, or embed live dashboards in your site or product. Export to CSV or PDF anytime.

NA
Noura Al Ali
Head of E-commerce
TB
Tom Becker
Performance Marketing
MC
Mei Chen
Customer Service

Share, embed, or export

Share with a link or email invite, or embed live dashboards in your site or product. Export to CSV or PDF anytime.

NA
Noura Al Ali
Head of E-commerce
TB
Tom Becker
Performance Marketing
MC
Mei Chen
Customer Service

Share, embed, or export

Share with a link or email invite, or embed live dashboards in your site or product. Export to CSV or PDF anytime.

Control who sees what

Everyone sees exactly what they should.

Enforced on every query, not left to the AI.

Finance4 of 5 datasets
Sales managers5 of 5 datasets
Regional sales reps4 of 5 datasets
+11 more
dim_customer6/8 fields
customer_idnamesegmentregionemailphonelifetime_valuecreated_at

Control who sees what

Everyone sees exactly what they should.

Enforced on every query, not left to the AI.

Finance4 of 5 datasets
Sales managers5 of 5 datasets
Regional sales reps4 of 5 datasets
+11 more
dim_customer6/8 fields
customer_idnamesegmentregionemailphonelifetime_valuecreated_at

Control who sees what

Everyone sees exactly what they should.

Enforced on every query, not left to the AI.

Finance4 of 5 datasets
Sales managers5 of 5 datasets
Regional sales reps4 of 5 datasets
+11 more
dim_customer6/8 fields
customer_idnamesegmentregionemailphonelifetime_valuecreated_at

Forecasting

See where your numbers are heading.

Ask a question → get a forecast back.

Garry

4:15am

Forecast online sales for the next 6 months

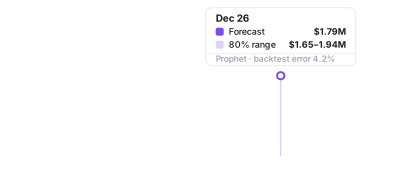
Here’s your 6-month online sales forecast. Sales keep climbing, with a December peak around $1.79M.

Hover the chart to see the range and how I built it.

Revenue forecast chart with an 80% confidence range

Sylus

4:15am

Forecasting

See where your numbers are heading.

Ask a question → get a forecast back.

Garry

4:15am

Forecast online sales for the next 6 months

Here’s your 6-month online sales forecast. Sales keep climbing, with a December peak around $1.79M.

Hover the chart to see the range and how I built it.

Revenue forecast chart with an 80% confidence range

Sylus

4:15am

Forecasting

See where your numbers are heading.

Ask a question → get a forecast back.

Garry

4:15am

Forecast online sales for the next 6 months

Here’s your 6-month online sales forecast. Sales keep climbing, with a December peak around $1.79M.

Hover the chart to see the range and how I built it.

Revenue forecast chart with an 80% confidence range

Sylus

4:15am

Stop waiting on reports. Just ask.

Stop waiting on reports. Just ask.

Generate any sales, marketing or margin report in seconds, then schedule it to land in your inbox daily, weekly or monthly.

Home

Feedback

Good afternoon, Erlich Bachman.

How can I help you today?

Home

Feedback

Good afternoon, Erlich Bachman.

How can I help you today?

Who Sylus is for in e-commerce

Who Sylus is for in e-commerce

Founders and CEOs of online brands who want one view of every store, marketplace and channel.

Growth and performance marketing teams tracking ad spend, ROAS and customer acquisition cost.

Finance teams checking margin, discounts, refunds and payouts by channel.

Merchandising and operations teams deciding what to restock, discount or drop.

Customer and retention teams watching repeat purchase rate, returns and customer lifetime value.

Things you won’t hear anymore

Things you won’t hear anymore

  • Jess Hitchcock

    Can you check these revenue numbers? Shopify and Google Analytics don't match.

  • Jess Hitchcock

    The marketing dashboard is broken again.

  • Hamzah Chaudhary

    Who built this ROAS report? I don't know what I'm looking at.

  • Hamzah Chaudhary

    Just send me last week's sales by channel in a spreadsheet.

  • Marshall Agnew

    Let me just export it to Excel and do it myself.

  • Jose Rego

    Where's the cohort report? I asked for it two weeks ago.

  • João Viana

    Can we get on a call to go over the weekly sales report? I don't get it.

  • Jess Hitchcock

    Which version of the inventory report is the latest one?

  • Jess Hitchcock

    Can you check these revenue numbers? Shopify and Google Analytics don't match.

  • Jess Hitchcock

    The marketing dashboard is broken again.

  • Hamzah Chaudhary

    Who built this ROAS report? I don't know what I'm looking at.

  • Hamzah Chaudhary

    Just send me last week's sales by channel in a spreadsheet.

  • Marshall Agnew

    Let me just export it to Excel and do it myself.

  • Jose Rego

    Where's the cohort report? I asked for it two weeks ago.

  • João Viana

    Can we get on a call to go over the weekly sales report? I don't get it.

  • Jess Hitchcock

    Which version of the inventory report is the latest one?

  • Jess Hitchcock

    Can you check these revenue numbers? Shopify and Google Analytics don't match.

  • Jess Hitchcock

    The marketing dashboard is broken again.

  • Hamzah Chaudhary

    Who built this ROAS report? I don't know what I'm looking at.

  • Hamzah Chaudhary

    Just send me last week's sales by channel in a spreadsheet.

  • Marshall Agnew

    Let me just export it to Excel and do it myself.

  • Jose Rego

    Where's the cohort report? I asked for it two weeks ago.

  • João Viana

    Can we get on a call to go over the weekly sales report? I don't get it.

  • Jess Hitchcock

    Which version of the inventory report is the latest one?

How it works

How it works

Three steps from raw data to answers you can trust.

Connect your data

500+ one-click connectors for your online store, marketplaces, ad platforms and accounting.

01

/03

Step

01
02
03
  • SAP logo
  • Oracle Netsuite logo
  • Microsoft Dynamics 365 logo
  • Microsoft SQL Server logo
  • PostgreSQL logo
  • Oracle Database logo
  • Snowflake logo
  • PostgreSQL logo
  • Salesforce logo
  • MySQL logo
  • SAP logo
  • BigQuery logo
  • Microsoft Dynamics 365 logo
  • Databricks logo
  • Oracle Database logo
  • MongoDB logo
  • Microsoft SQL Server logo
  • Odoo logo
  • Shopify logo
  • SAP logo
  • QuickBooks Online logo
  • Microsoft Dynamics 365 logo
  • HubSpot logo
  • PostgreSQL logo
  • Stripe logo
  • Oracle Netsuite logo
  • Microsoft Excel Online logo
  • ClickHouse logo
  • Microsoft SQL Server logo
  • Xero logo
  • SAP logo
  • MariaDB logo
  • Google Sheets logo
  • PostgreSQL logo
  • Zoho CRM logo
  • Which campaigns need attention today?

  • Remind me about…

  • Summarize last week's sales.

  • Prepare me for my growth meeting.

  • Which campaigns need attention today?

  • Remind me about…

  • Summarize last week's sales.

  • Prepare me for my growth meeting.

  • Which campaigns need attention today?

  • Remind me about…

  • Summarize last week's sales.

  • Prepare me for my growth meeting.

  • Which campaigns need attention today?

  • Remind me about…

  • Summarize last week's sales.

  • Prepare me for my growth meeting.

  • Which campaigns need attention today?

  • Remind me about…

  • Summarize last week's sales.

  • Prepare me for my growth meeting.

revenue by channel

183ms

top 10 SKUs by margin

183ms

best-sellers low on stock

183ms

ROAS by campaign

183ms

AOV by channel

183ms

repeat purchase rate

183ms

Connect your data

500+ one-click connectors for your online store, marketplaces, ad platforms and accounting.

01

/03

Icon
Icon

Step

01
02
03
  • SAP logo
  • Oracle Netsuite logo
  • Microsoft Dynamics 365 logo
  • Microsoft SQL Server logo
  • PostgreSQL logo
  • Oracle Database logo
  • Snowflake logo
  • PostgreSQL logo
  • Salesforce logo
  • MySQL logo
  • SAP logo
  • BigQuery logo
  • Microsoft Dynamics 365 logo
  • Databricks logo
  • Oracle Database logo
  • MongoDB logo
  • Microsoft SQL Server logo
  • Odoo logo
  • Shopify logo
  • SAP logo
  • QuickBooks Online logo
  • Microsoft Dynamics 365 logo
  • HubSpot logo
  • PostgreSQL logo
  • Stripe logo
  • Oracle Netsuite logo
  • Microsoft Excel Online logo
  • ClickHouse logo
  • Microsoft SQL Server logo
  • Xero logo
  • SAP logo
  • MariaDB logo
  • Google Sheets logo
  • PostgreSQL logo
  • Zoho CRM logo
  • Which campaigns need attention today?

  • Remind me about…

  • Summarize last week's sales.

  • Prepare me for my growth meeting.

  • Which campaigns need attention today?

  • Remind me about…

  • Summarize last week's sales.

  • Prepare me for my growth meeting.

  • Which campaigns need attention today?

  • Remind me about…

  • Summarize last week's sales.

  • Prepare me for my growth meeting.

  • Which campaigns need attention today?

  • Remind me about…

  • Summarize last week's sales.

  • Prepare me for my growth meeting.

  • Which campaigns need attention today?

  • Remind me about…

  • Summarize last week's sales.

  • Prepare me for my growth meeting.

revenue by channel

183ms

top 10 SKUs by margin

183ms

best-sellers low on stock

183ms

ROAS by campaign

183ms

AOV by channel

183ms

repeat purchase rate

183ms

Built for the people who run the business

Enable everyone to explore data on their own

Loved by business users, trusted by data teams.

What people are saying

What people are saying

  • Ryan Johnson
    Ryan Johnson

    Head of Operations

    We used to wait days for a simple report. Now my team gets answers in seconds. Sylus didn't just save us time, it completely changed how we make decisions.

  • Michael Brown
    Michael Brown

    Head of Analytics

    I was skeptical at first, we've tried BI tools before. But Sylus is different. It actually understands the question you're asking instead of making you learn its language.

  • David Martinez
    David Martinez

    VP of Finance

    Our finance team was drowning in ad hoc requests. Sylus took that off their plate overnight. The numbers are accurate, the answers are fast, and my team finally has time to think strategically.

  • John Smith
    John Smith

    Marekting Director

    We connect all our ad platforms and Sylus pulls everything together in one place. No more jumping between tabs and spreadsheets to figure out what's working.

  • Rayan Ahmed
    Ahmed Alrachdi

    Revenue Operations Manager

    The best part is I don't need to file a ticket anymore. I just ask the question and get the answer. It sounds small but it changed everything about how fast we move.

  • David Martinez
    David Martinez

    Head of Data

    We spent two years building dashboards that nobody used. Sylus replaced all of that in a week. Now people actually look at the data because they can just ask for what they need.

  • Karim Mustafa
    Karim Mustafa

    CEO

    I used to walk into Monday meetings without the numbers I needed. Now I ask Sylus on Sunday night and show up with the full picture. It's that simple.

  • Ryan Johnson
    Ryan Johnson

    Head of Operations

    I used to rely on three different people to get a single number. Now I ask Sylus and have it before my coffee is ready. It sounds like an exaggeration but it's not.

  • Ryan Johnson
    Ryan Johnson

    Head of Operations

    We used to wait days for a simple report. Now my team gets answers in seconds. Sylus didn't just save us time, it completely changed how we make decisions.

  • Michael Brown
    Michael Brown

    Head of Analytics

    I was skeptical at first, we've tried BI tools before. But Sylus is different. It actually understands the question you're asking instead of making you learn its language.

  • David Martinez
    David Martinez

    VP of Finance

    Our finance team was drowning in ad hoc requests. Sylus took that off their plate overnight. The numbers are accurate, the answers are fast, and my team finally has time to think strategically.

  • John Smith
    John Smith

    Marekting Director

    We connect all our ad platforms and Sylus pulls everything together in one place. No more jumping between tabs and spreadsheets to figure out what's working.

  • Rayan Ahmed
    Ahmed Alrachdi

    Revenue Operations Manager

    The best part is I don't need to file a ticket anymore. I just ask the question and get the answer. It sounds small but it changed everything about how fast we move.

  • David Martinez
    David Martinez

    Head of Data

    We spent two years building dashboards that nobody used. Sylus replaced all of that in a week. Now people actually look at the data because they can just ask for what they need.

  • Karim Mustafa
    Karim Mustafa

    CEO

    I used to walk into Monday meetings without the numbers I needed. Now I ask Sylus on Sunday night and show up with the full picture. It's that simple.

  • Ryan Johnson
    Ryan Johnson

    Head of Operations

    I used to rely on three different people to get a single number. Now I ask Sylus and have it before my coffee is ready. It sounds like an exaggeration but it's not.

Your data is in safe hands

Your data is in safe hands

This includes state-of-the-art encryption, safe and reliable infrastructure partners, and independently verified security controls.

SOC 2 Type II compliant

Sylus has undergone a Service Organization Controls audit (SOC 2 Type II)

HIPAA compliant

Privacy & security measures to ensure that PHI is appropriately safeguarded.

Permissions & governance

Provision users, enforce permissions, & implement robust governance.

IP protection policy

Neither Sylus nor our model partners train models on customer data.

Self-hosted deployment

In select cases, deploy in your own air-gapped environment.

Secure connections

SSL and pass-through OAuth available.

Connects to your store and ad platforms

Connects to your store and ad platforms

Sylus connects with read-only access and never writes to your systems. Popular integrations for e-commerce brands:

Frequently asked questions

Frequently asked questions

What is AI e-commerce analytics?

AI e-commerce analytics lets anyone in an online business ask about sales, margin, marketing and stock in plain English and get answers, charts and dashboards from their store, marketplaces and ad platforms. Sylus is a self-learning AI data analyst that does this and shows the SQL behind every number.

Can Sylus combine Shopify, Amazon and ad platform data?

Yes. Sylus connects to online stores such as Shopify, WooCommerce, BigCommerce and Adobe Commerce, marketplaces such as Amazon, ad platforms such as Meta Ads, Google Ads and Google Analytics 4, and payment tools such as Stripe and PayPal. One question can cover orders, ad spend and payouts. Sylus connects with read-only access and never writes to your systems.

Can Sylus track ROAS and customer acquisition cost?

Yes. Ask for ROAS by campaign, customer acquisition cost by channel or revenue from new versus returning customers, and get the answer as a table, chart or dashboard. You can also get an alert when spend, conversion or ROAS spikes or drops.

Do our marketers need SQL or BI training?

No. If they can type a question, they can use Sylus. No SQL or BI training is needed, and role-based permissions mean each person only sees the data they are allowed to see.

Can Sylus show profit, not just revenue?

Yes. When your product costs are in your store, ERP or a spreadsheet, Sylus can report gross margin and margin after discounts, refunds and ad spend, by product, channel or campaign, from your own data.

Which e-commerce KPIs can Sylus report on?

Any KPI your data supports, including revenue, orders, average order value, conversion rate, ROAS, customer acquisition cost, repeat purchase rate, customer lifetime value, return rate, gross margin and stock cover. Sylus answers from its semantic layer, so everyone gets the same definitions and the same numbers.

Does Sylus work for brands selling in several countries?

Yes. Sylus combines stores, marketplaces and currencies, including AED and SAR, into group-level numbers without consolidating spreadsheets by hand, and it answers questions in Arabic as well as English.

How is Sylus different from a BI tool like Power BI or Tableau?

With a BI tool, someone has to build each dashboard first, and every new question becomes a request to the data team. With Sylus, anyone asks in plain English and gets the answer, chart or dashboard straight away, built from your own store, marketplace and ad data.

How is Sylus priced?

Sylus is quoted for your setup. Your price depends on how many data sources you connect and what types they are, with unlimited users, so your whole team can have access. You can start with a free 30-day proof of concept on your own data.


Get a call back

Get a call back

No commitment. No sales pitch. Just a 15-minute conversation to see if Sylus fits your team.

Get a call back

No commitment. No sales pitch. Just a 15-minute conversation to see if Sylus fits your team.

revenue by channel

183ms

top 10 SKUs by margin

183ms

best-sellers low on stock

183ms

ROAS by campaign

183ms

AOV by channel

183ms

repeat purchase rate

183ms

Schedule reports & alerts

Sylus thoroughly explores your data & validates assumptions before returning a final deliverable.

Free 30-day proof of concept

Try Sylus on your own data for 30 days before you commit.

Built on governed context

Sylus grounds all analysis and exploration in its semantic layer (and your dbt models, if you use dbt).

Schedule reports & alerts

Sylus thoroughly explores your data & validates assumptions before returning a final deliverable.

Free 30-day proof of concept

Try Sylus on your own data for 30 days before you commit.

Built on governed context

Sylus grounds all analysis and exploration in its semantic layer (and your dbt models, if you use dbt).