Introduction
A marketing manager needs last week's campaign numbers. A sales lead wants to see pipeline trends before a Monday call. Both submit a ticket — and wait three days for a report. According to Dresner Advisory Services' 2025 Self-Service BI Market Study, 92% of organizations consider self-service BI access control at least important, yet most still struggle with these exact bottlenecks.
Self-service business intelligence (BI) solves this problem by empowering business users to independently access, explore, and visualize data without submitting tickets to IT. This article breaks down what self-service BI is, why it matters, and how to implement it successfully.
Key Takeaways
- Self-service BI enables non-technical users to access and analyze data independently without IT support
- Speeds decision-making by eliminating report request bottlenecks that delay insights by days or weeks
- AI-powered platforms let anyone explore data using plain-English questions, no SQL required
- Governance frameworks keep data accurate and trustworthy without restricting user exploration
- Successful rollouts depend on clean data, defined goals, and role-based training from the start
What is Self-Service BI?
Self-service BI is an approach to data analytics that enables non-technical business users to independently access, explore, and visualize data—without submitting tickets to IT or waiting on data analysts. Instead of relying on a small group of technical specialists, any employee who needs data to make a decision can get answers directly.
Who Benefits Most
The core premise shifts analytics capabilities from IT gatekeepers to the people who actually need insights:
- Marketing managers tracking campaign performance
- CFOs monitoring cash flow in real time
- Operations teams identifying process bottlenecks
- Department heads and executives making strategic decisions
Any function where timely data access drives better outcomes gains immediate value.
The Self-Service Spectrum
Self-service BI isn't binary. Traditional BI sits at one end (IT-controlled, expert-only), while fully self-service AI-driven analytics sits at the other. Most organizations land somewhere in the middle—users can request pre-built reports but can't yet build their own, or they can create dashboards but still rely on analysts for complex queries. The spectrum reflects how much autonomy business users have, from requesting static reports all the way to asking questions in plain English.
Typical Self-Service Workflow
In practice, the workflow looks like this:
- A business user connects to a governed data source
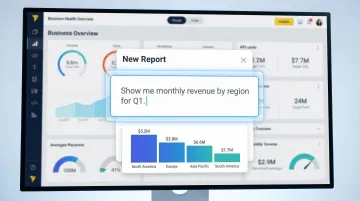
- They ask a question via drag-and-drop, natural language processing (NLP), or a query interface
- They receive a visualization or dashboard—no code written, no request filed
For example, a sales manager might ask "What were total sales for each sales rep from the last 12 months?" and receive an interactive dashboard showing performance trends in seconds. Sylus extends this further: rather than generating answers from raw queries alone, it grounds every analysis in your dbt models and documentation—so AI-generated insights are fast and verifiable, not just plausible.
Self-Service BI vs. Traditional BI
Traditional BI: The Bottleneck Model
Traditional BI operates as a centralized system where IT or BI teams own the entire pipeline—from data extraction and transformation to writing queries, designing dashboards, and delivering reports. Business users submit requests and wait. This creates a bottleneck where answers arrive weeks later, often stale before anyone acts on them.
The problem compounds in fast-moving markets where decisions delayed are opportunities lost. When every report requires a data analyst's time, organizations can't scale analytics to meet demand.
Self-Service BI: Distributed Analytics
Self-service BI flips this model. Business users own the exploration and reporting layer directly, while IT and data teams shift focus to higher-value work: data governance, modeling infrastructure, and building trusted data sources. This reduces the backlog without sacrificing oversight.
The Governance Balance
The best self-service BI implementations combine user freedom with real controls. That means governed data models, role-based access, and a single source of truth—not an open-ended free-for-all.
Without those guardrails, teams drift toward conflicting numbers for the same metric. Different spreadsheets, different definitions, different answers. Effective self-service BI prevents this by having users work with pre-validated data models rather than raw tables, ensuring accuracy without requiring IT sign-off on every query.
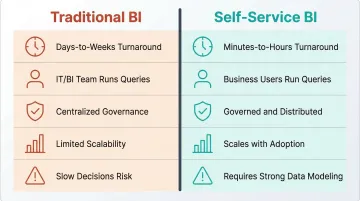
Here's how the two approaches compare:
| Traditional BI | Self-Service BI | |
|---|---|---|
| Who runs queries | IT / BI team | Business users |
| Report turnaround | Days to weeks | Minutes to hours |
| Data governance | Centralized | Governed + distributed |
| Scalability | Limited by analyst capacity | Scales with user adoption |
| Risk | Slow decisions | Requires strong data modeling |
Key Benefits of Self-Service BI
Faster Decision-Making
Business users can answer their own questions in real time instead of waiting days for a report request to be fulfilled. This speed advantage compounds—especially in fast-moving markets where decisions delayed are opportunities lost. When a marketing manager can see campaign performance immediately rather than waiting for a weekly report, they can adjust strategy on the fly and capture opportunities before competitors do.
Reduced IT and Analyst Bottleneck
When business users self-serve, data teams are freed from repetitive reporting tasks and can focus on strategic work—data modeling, pipeline quality, and building governed infrastructure. Research shows data teams spend significant time on ad hoc report requests. Self-service BI reclaims that time for higher-impact work.
Increased Data Literacy Across the Organization
The act of exploring data builds familiarity with metrics, trends, and analytical thinking. Over time, self-service BI creates a data-driven culture where employees at all levels are comfortable questioning numbers and validating assumptions. The result: analytical thinking stops being a specialist skill and becomes an organizational habit.
A Single, Trusted Source of Truth
Self-service BI, when built on governed data models, eliminates the "spreadsheet wars" problem—where different teams produce conflicting numbers for the same metric. A well-governed self-service environment ensures everyone works from the same definitions.
Key signs a governed self-service environment is working:
- Sales and finance pull identical revenue figures from the same validated model
- Metric definitions are documented and consistent across dashboards
- Discrepancies surface immediately, not weeks later in a board meeting
Competitive Agility
Organizations that can quickly surface insights, test hypotheses, and act on data move faster than competitors still waiting on manual reporting cycles. Gartner predicts that 75% of new analytics content will be contextualized through generative AI by 2027, highlighting how AI-powered self-service BI is becoming essential for staying competitive.
Key Features to Look for in a Self-Service BI Tool
Not every BI tool delivers true self-service. Evaluating options across three core areas — usability, governance, and collaboration — narrows the field quickly.
Intuitive Interface and NLP Querying
The tool must be usable by non-technical employees. Key indicators include:
- Drag-and-drop dashboard building for visual report creation
- Natural language querying — users ask questions in plain English, no SQL required
- Pre-built templates that cut setup time significantly
- Minimal training requirements so non-technical users can start exploring on day one
According to Gartner's 2025 analytics research, over 50% of organizations now use AI tools for automated insights and natural language queries—making NLP capabilities a baseline requirement for any modern BI tool.
Data Connectivity and Governance Controls
Look for broad data source connectivity—databases, cloud warehouses, SaaS apps—combined with robust governance:
- Role-based access control to restrict sensitive data by team or function
- **Data masking and row-level security** for compliance requirements
- Governed semantic layer support — tools like dbt models ensure users explore trusted, documented data rather than raw uncleaned tables
- Policy-based access controls that adapt as teams and data structures grow
Dresner's 2025 study found that 63% of organizations rate governance controls as critical or very important, with 92% considering them at least important—making governance a foundational requirement, not an afterthought.
Collaboration and Sharing Capabilities
Effective self-service BI is never purely individual. The tool should support:
- Sharing dashboards via link or email for easy distribution
- Embedding into other applications so insights surface inside existing workflows
- Scheduled report delivery so stakeholders receive updates automatically
- Team-level annotations and alerts that keep analysis collaborative and keep the right people informed
Sylus, for example, lets users query data and share visualizations directly inside Slack — no context switching required.
How AI is Transforming Self-Service BI
The Next Evolution: AI-Powered Analytics
AI is changing what self-service BI actually requires of users. Instead of knowing which chart to build or which filters to apply, users can ask plain English questions — and the AI interprets intent, validates assumptions, and returns a complete, accurate deliverable. No SQL. No dashboard training.
Users can ask "Show me my top customers" and receive formatted visualizations with insights in seconds. This conversational approach removes the technical barrier entirely, making analytics accessible to employees who would never have learned SQL or dashboard design.
The Role of Governed AI Context
AI-generated insights can go wrong when the model doesn't understand your business logic — returning numbers that look right but reflect the wrong definition of a metric. The most effective tools address this by grounding analysis in a governed semantic layer, such as dbt models and documentation, so the AI works from your definitions before answering.
Sylus takes this approach directly — every analysis is built on top of your dbt context, so outputs reflect your actual metric definitions rather than the AI's best guess. This keeps results both fast and trustworthy.
Enterprise Readiness Factors
When AI is involved, enterprise readiness factors matter:
- No model training on customer data — your business logic stays yours
- Self-hosted or cloud deployment for organizations with strict data residency requirements
- SOC 2 Type II and HIPAA compliance for regulated industries
- Unlimited seats with usage-based pricing, so adoption isn't capped by per-user licensing
Sylus meets all four of these criteria, making it viable for data teams at F1000 companies and fast-growing startups alike.
Best Practices for Self-Service BI Implementation
Audit Your Data Before You Launch
Before selecting a tool, assess your existing data sources, quality, and governance posture. Identify where data lives, whether definitions are consistent across teams, and which gaps need to be closed. A self-service BI rollout built on messy or inconsistent data will erode trust faster than it builds it.
Ask: Do we have a single source of truth for key metrics? Are data definitions documented? Which data quality issues need resolution before we empower broader access?
Define Clear Goals and Success Metrics
Establish upfront what success looks like:
- Average time to generate a report
- Percentage of employees actively using the platform weekly
- Reduction in ad hoc IT requests
- Time-to-decision for key business processes
Without measurable benchmarks, it's impossible to evaluate adoption or justify continued investment. Set baseline metrics before rollout and track them monthly.
Involve Key Stakeholders Early
Include representatives from IT, data teams, and end-user departments in the selection and rollout process. Power users who join early become internal advocates, and surfacing objections upfront — data access concerns, tool usability doubts — prevents post-launch resistance. Build a cross-functional steering committee that includes the people who will use the tool daily, not just those who sign the budget.
Establish Data Governance Guardrails from Day One
Before users start exploring, define:
- Who can access which data sets
- How key metrics are defined and documented
- Who owns data quality for each domain
- How new data sources get vetted before entering the BI layer
Governance is not a constraint on self-service—it's what makes self-service trustworthy at scale.
Implement role-based access controls, document metric definitions in a central repository, and establish a data quality monitoring process before users start exploring.
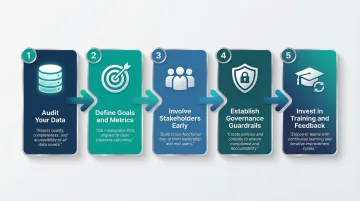
Invest in Training and Build a Feedback Loop
Every tool requires onboarding, even intuitive ones. Invest in role-specific training that connects users to data relevant to their function — a marketing analyst needs a different starting point than a finance lead.
A structured feedback loop is equally critical. Self-service BI programs that ignore user input stagnate and lose adoption. Build these feedback practices in from the start:
- Collect issues, success stories, and feature requests on a regular cadence
- Schedule monthly sessions with active users
- Adjust governance policies and training materials based on what you learn
Frequently Asked Questions
What is self-service business intelligence?
Self-service BI is an approach to data analytics that empowers non-technical business users to independently access, explore, and visualize data using intuitive tools and governed data models—without relying on IT teams for every report request.
What is the difference between self-service BI and traditional BI?
In traditional BI, IT and analysts own the entire workflow from data extraction to report delivery. In self-service BI, business users access and analyze data themselves while IT focuses on governance, infrastructure, and data quality.
What are the benefits of self-service BI?
Self-service BI speeds up decisions by cutting report request delays and reduces IT bottleneck so analysts can focus on strategic work. It also builds data literacy across teams, establishes a single source of truth, and improves organizational agility.
What are examples of self-service BI tools?
Commonly cited platforms include Tableau, Microsoft Power BI, Qlik, Looker, and Amazon QuickSight. Sylus takes a different approach — it lets users query governed business data in plain English, with native dbt integration and unlimited user seats, making it well-suited for modern data teams.
What are the three major types of business intelligence?
The three types are descriptive BI (what happened—reports and dashboards), diagnostic BI (why it happened—root cause analysis), and predictive/prescriptive BI (what will happen and what to do about it—forecasting and recommendations).
What is a BI service?
A BI service is the platform or infrastructure that collects, processes, and presents business data for analysis. Delivery formats vary — from full-stack SaaS platforms to embedded analytics and self-hosted deployments.