This guide explains what self-service reporting is, how it works, the different report types available, key benefits backed by research, and practical steps to implement it in your organization.
Key Takeaways
- Self-service reporting lets non-technical users independently access, analyze, and generate reports without SQL or IT support
- Modern tools use AI to turn plain English questions into instant dashboards and visualizations
- Organizations reduce report turnaround from months to days while freeing data teams for strategic work
- Forrester studies show 289-486% ROI from self-service BI adoption
- Success requires governed data infrastructure, role-based access controls, and basic user training
What is Self-Service Reporting?
Self-service reporting is a business intelligence approach that puts data access and report creation in the hands of non-technical business users, removing dependency on IT, data engineers, or analysts to answer everyday questions.
How it works: Users connect a reporting tool to a live data source, query it using a visual interface or natural language, and generate reports or dashboards on demand—no coding required. The process typically takes seconds rather than days.
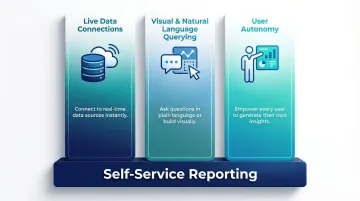
Three Capabilities That Make It Work
Self-service reporting rests on three core capabilities:
- Direct connections to databases, warehouses, and SaaS platforms—no manual exports or CSV wrangling
- Visual drag-and-drop or plain English questions that replace the need for SQL
- Business users who can build, customize, and share reports without filing a ticket
How AI Raised the Bar
Modern platforms have pushed self-service reporting further through AI integration. Tools like Sylus let users ask questions in plain English and receive validated, AI-generated dashboards instantly. These systems ground every answer in governed data context—such as dbt models—ensuring consistency while maintaining accessibility.
For example, a sales manager can type "show me top customers by revenue last quarter" and receive a formatted bar chart with insights in seconds, without understanding database schemas or metric definitions.
Who Uses Self-Service Reporting
Self-service reporting serves diverse business roles:
- Marketing managers checking campaign performance and conversion rates
- Sales representatives tracking pipeline stages and deal velocity
- Operations teams monitoring fulfillment KPIs and inventory levels
- Finance analysts reviewing budget variance and cash flow
- Product managers analyzing feature adoption and user engagement
The common thread: each role needs fast, reliable answers—without waiting on a data team.
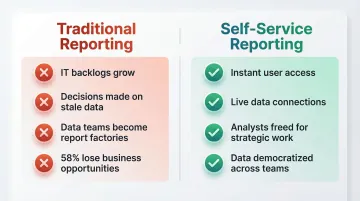
Self-Service Reporting vs. Traditional Reporting
Traditional reporting keeps data locked behind IT queues. Self-service reporting puts it directly in the hands of the people who need it — and the operational difference is significant.
Speed: Days to Seconds
Traditional IT-led reporting often takes months to fulfill. Organizations using Microsoft Power BI reduced report turnaround from months to an average of 2.7 days, while ThoughtSpot users became 95% faster at making report changes themselves.
Self-service tools deliver answers in real-time, cutting decision time from weeks to minutes.
Dependency: Analyst Bottlenecks vs. User Autonomy
Traditional reporting requires business users to submit requests to analysts or IT, creating queues and dependencies. Self-service models eliminate this intermediary—users generate their own reports when needed.
Data Freshness: Static Snapshots vs. Live Connections
Traditional reports are often static exports — by the time a stakeholder acts on them, the underlying data has already moved. Self-service tools connect directly to live data sources, so dashboards reflect current numbers without requiring a manual refresh or a new ticket to IT.
The Downstream Cost of Traditional Reporting
The traditional model creates organizational friction:
- IT backlogs grow as request volume outpaces analyst capacity
- Business users make decisions on stale data, missing market opportunities
- Data teams become "report factories" instead of strategic contributors building infrastructure and governance
- 58% of employees report losing business opportunities because they cannot access data in a timely manner (OpenText / Foundry Research, 2024)
Self-Service Doesn't Eliminate Data Teams
These costs don't disappear on their own — but self-service reporting addresses them by redirecting data team effort away from repetitive requests. Analysts shift toward higher-value work: building reliable data infrastructure, implementing governance frameworks, and conducting deeper analysis. Looker customers reported reducing their reliance on BI teams for analytics by 99%, freeing analysts to focus on strategic initiatives.
Types of Self-Service Reports
Self-service platforms support multiple report formats tailored to different business needs.
Ad-hoc Reports
Ad-hoc reports are one-off, on-demand queries created to answer specific, immediate questions—for example, "What were our top-performing products last quarter in the Northeast region?"
These exploratory reports don't follow fixed templates. Users generate them when they need quick answers without waiting for scheduled reporting cycles.
Recurring/Scheduled Reports
Scheduled reports are automatically generated and delivered on a set cadence via email or Slack. They replace manual report-building routines and keep stakeholders consistently informed without extra effort.
Common examples include:
- Weekly sales summaries
- Monthly financial statements
- Daily operational metrics
Interactive Dashboards
Interactive dashboards are live, visual displays of key metrics where users can apply filters, drill down into data, and explore different dimensions without requesting new reports.
These are the most common output of self-service reporting tools. Users monitor real-time KPIs, adjust date ranges, segment by region or product, and uncover insights through exploration.
Embedded Reports
Embedded reporting integrates analytics directly into existing applications or products so end users—customers, partners, or internal teams—can access insights without leaving their workflow.
This is especially useful for SaaS products and internal portals where in-context analytics reduce friction and improve adoption.
AI-Generated Summaries and Alerts
AI-generated summaries and anomaly alerts proactively surface insights—such as "Revenue spiked 40% on Thursday—here's why"—rather than waiting for users to ask.
Sylus, for example, automatically detects significant changes and delivers plain-English explanations via email or Slack, so stakeholders catch critical shifts without manually checking dashboards.
Key Benefits of Self-Service Reporting
The case for self-service reporting isn't theoretical — the productivity gains, cost savings, and ROI figures are documented across organizations of every size.
Faster Time to Insight
Self-service tools compress the data-to-decision lifecycle significantly. Microsoft Power BI users reduced report turnaround from months to 2.7 days, while Tableau reduced report creation times by 87.5%.
Teams stop waiting on reports that arrive after the decision window has closed — and start acting on data that reflects what's happening now.
Frees Data and IT Teams for Strategic Work
When business users answer their own questions, analysts and engineers focus on data modeling, pipeline reliability, governance, and high-impact projects instead of fielding routine requests.
Implementing self-service BI reduces centralized analytics team effort by 42%, recapturing valuable technical resources for strategic initiatives.
Improved Data Accuracy and Trust
Self-service tools with governed data layers reduce the risk of users pulling from inconsistent spreadsheets or outdated exports. When everyone queries the same governed source—such as dbt models—metric definitions stay consistent across teams.
This eliminates the common problem where different departments report conflicting numbers for the same KPI, eroding confidence in data-driven decisions.
Scales Data Culture Across the Organization
Self-service reporting builds organizational data literacy. As more employees interact with data directly, the organization develops broader analytical competency.
Only 41% of data and analytics employees are considered data literate according to a 2023 Forrester survey — which means most organizations have significant room to grow. Closing that gap is one of the highest-leverage investments a data team can make.
Revenue and ROI Impact
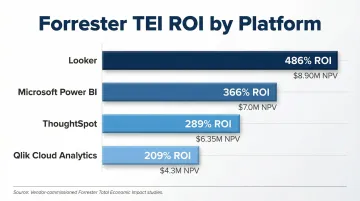
Better decisions enabled by faster, more accurate data access translate to measurable business outcomes. Vendor-commissioned Forrester Total Economic Impact studies consistently demonstrate triple-digit ROI:
- Looker: 486% ROI with $8.90M net present value
- Microsoft Power BI: 366% ROI with $7.0M net present value
- ThoughtSpot: 289% ROI with $6.35M in business benefits
- Qlik Cloud Analytics: 209% ROI with $4.3M net present value
Organizations also report productivity gains including 125 hours saved per BI user annually and 24%+ boost in general employee productivity.
How to Implement Self-Service Reporting in Your Organization
Successful implementation requires planning, the right tools, and organizational change management.
Assess Your Data Infrastructure and User Needs
Before choosing a tool, map out:
- Which teams and roles require self-service reporting
- What the most common report requests actually are
- Which databases, warehouses, and SaaS platforms hold relevant data
- How comfortable typical business users are with data tools
This scoping keeps your rollout right-sized from the start — and surfaces gaps before they become blockers.
Choose the Right Self-Service Reporting Tool
Evaluate platforms based on:
- Intuitive interface that non-technical users can navigate without training
- Live data connectivity to your existing databases, warehouses, and SaaS tools
- Role-based access controls and row-level security for governed sharing
- Security compliance relevant to your industry (SOC 2, HIPAA)
- Pricing that scales with your organization without penalizing adoption
Some platforms go beyond dashboards. Sylus, for example, lets users query data in plain English, auto-generate shareable dashboards, and schedule AI-generated summaries to Slack or email. Its unlimited-seat model means broader access doesn't inflate costs as your team grows.
Train Users and Establish a Governance Model
Pair tool rollout with lightweight data literacy programs so users understand:
- What data they can access
- How to interpret it correctly
- When to escalate to a data analyst
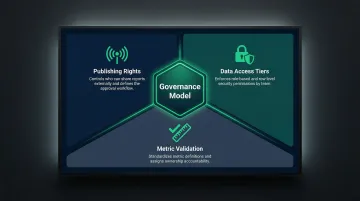
Governance doesn't have to be bureaucratic. Define three things clearly:
- Publishing rights: who can share reports externally, and through what approval workflow
- Data access tiers: which teams see sensitive data, enforced through row-level security
- Metric validation: how definitions get standardized and who owns verification
Platforms with built-in verification workflows, where reports move through structured stages like In Review, Verified, and Backlogged, help maintain quality without creating bottlenecks for everyday users.
Best Practices for Self-Service Reporting
Start with Governed, Centralized Data
Self-service reporting only works if users query a single, trustworthy data source. Avoid letting teams pull from disconnected spreadsheets or shadow databases.
Recommended setup: Connect a cloud data warehouse or lakehouse to a governed semantic layer — such as dbt models — that defines consistent business logic and metric calculations. This ensures all users work from the same definitions.
Build a Library of Starter Templates
Reduce time-to-value for new users by pre-building report templates for common use cases:
- Weekly sales summary
- Marketing funnel analysis
- Operations dashboard
- Financial variance reports
Templates lower the barrier to entry without restricting exploration. Users can start with proven frameworks and customize as needed.
Implement Role-Based Access Controls from Day One
Define who sees what data — down to row-level security if needed — before users start building reports. 71% of employees have access to data they shouldn't see according to a Ponemon Institute study, making upfront access configuration critical.
Proper governance delivers two concrete outcomes:
- Data protection: Sensitive financial, HR, or customer data stays visible only to authorized roles
- Regulatory compliance: Platforms like Sylus carry SOC 2 Type II and HIPAA certifications, meeting enterprise security requirements without limiting access for approved users
Frequently Asked Questions
What is self-service reporting?
Self-service reporting is a business intelligence approach that lets non-technical business users access, query, and generate reports from live data independently, without relying on IT or data analysts. Users ask questions in plain English or use visual interfaces to create dashboards and insights on demand.
How does self-service reporting work?
Users connect a reporting tool to a live data source, then use a visual interface or natural language queries to pull data and generate charts, dashboards, or reports—no SQL or coding required. Modern AI-powered platforms ground analysis in governed data models (like dbt) to ensure accuracy while maintaining accessibility.
What are examples of self-service reporting?
Common examples include a marketing manager building a campaign performance dashboard to track conversion rates, a sales rep pulling a weekly pipeline report to monitor deal stages, or an operations lead setting up an automated daily fulfillment summary delivered to Slack.
What are the different types of self-service reports?
The main types are:
- Ad-hoc reports — one-off queries for immediate, in-the-moment questions
- Scheduled/recurring reports — automated delivery on set cadences (daily, weekly, monthly)
- Interactive dashboards — live visualizations with drill-down and filter capabilities
- Embedded reports — analytics integrated directly into applications or workflows
- AI-generated summaries and alerts — proactive insights flagging anomalies as they occur
What is the difference between self-service reporting and traditional BI reporting?
Traditional BI requires business users to submit report requests to analysts or IT, taking days or weeks and resulting in stale data. Self-service reporting lets users generate their own reports in real time, connecting directly to live data sources and eliminating dependency on technical intermediaries.
Is self-service reporting secure enough for enterprise use?
Yes. Enterprise-grade tools include role-based access controls, row-level security, and compliance certifications (SOC 2 Type II, HIPAA) to protect sensitive data—even as access is democratized across teams. Self-hosted deployment is also available for organizations that require fully air-gapped environments.