Introduction
The modern enterprise manages an average of 897 applications, yet only 28% are integrated—creating data silos that cost organizations $12.9 million annually due to poor data quality. Knowledge workers lose nearly 12 hours each week simply searching for information scattered across CRMs, billing systems, product analytics, and spreadsheets. This fragmentation doesn't just slow decision-making; it creates a "silent productivity tax" where 68% of enterprise data goes completely unleveraged.
SaaS Business Intelligence directly addresses these gaps. It replaces legacy on-premise BI systems with always-on, browser-based analytics that eliminate hardware costs, slash implementation timelines from months to days, and put data access in the hands of every team—not just IT.
This article covers three essentials: a clear definition of SaaS BI, the leading tools reshaping the market, and real-world examples of companies turning fragmented data into actionable insights.
Key Takeaways
- SaaS BI delivers cloud-hosted analytics via browser—no hardware, installations, or IT maintenance required
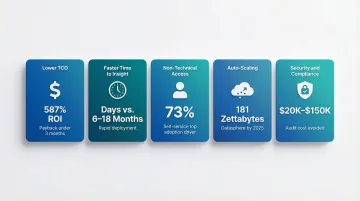
- Deployment takes days instead of months, with ROI exceeding 300% and payback periods under six months
- Top platforms include Sylus (AI-native, unlimited seats), Tableau (visual exploration), Power BI (Microsoft ecosystem), Looker (governed data layers), and Domo (all-in-one)
- Most teams use SaaS BI for subscription metrics, sales pipeline analysis, product performance monitoring, and automated reporting
- Choose based on team technical skill, data source compatibility, compliance needs, and pricing model scalability
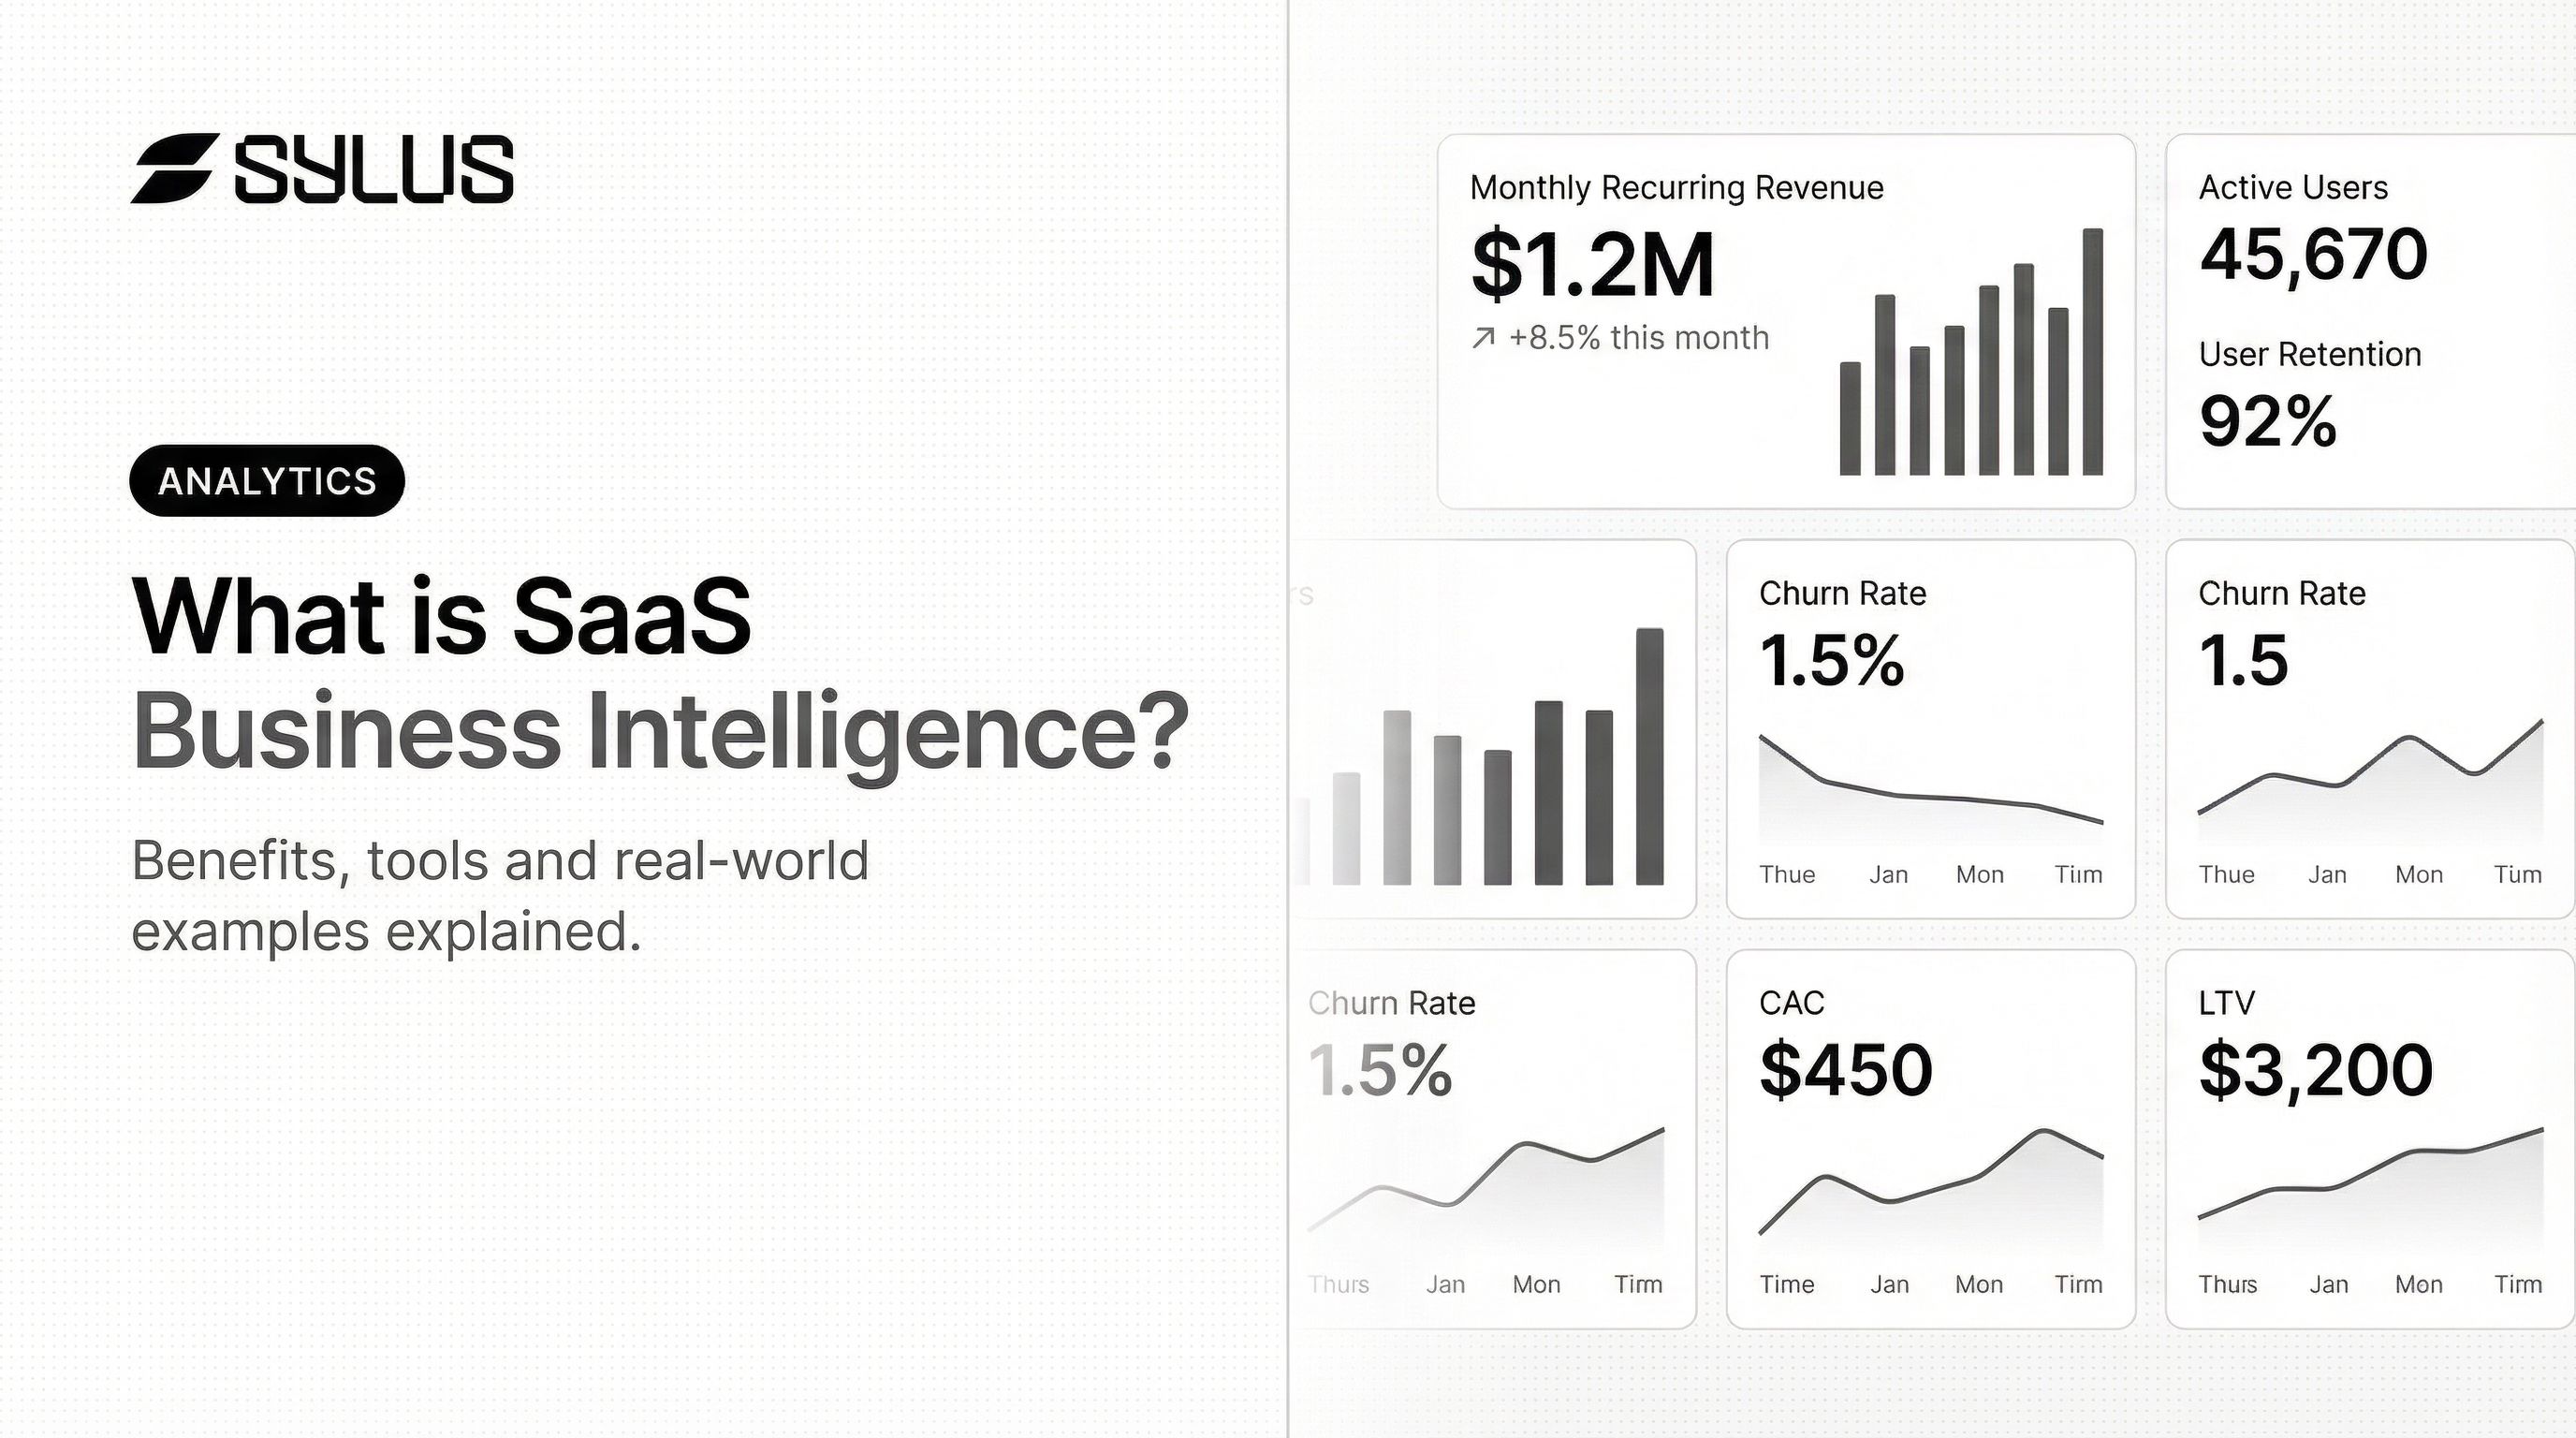
What is SaaS Business Intelligence?
SaaS Business Intelligence refers to cloud-delivered software that collects, processes, and visualizes business data without requiring on-premise servers or internal IT infrastructure. The vendor manages the entire platform—security, updates, scaling—while users access dashboards and analytics through a browser. Unlike traditional BI systems that demand hardware procurement and months-long implementations, SaaS BI platforms deploy in days and scale automatically as data volumes grow.
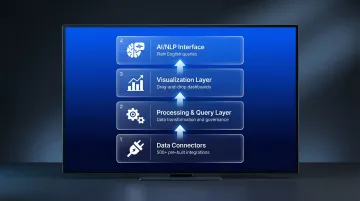
A complete SaaS BI system includes four core components:
Data connectors pull information from databases, CRMs, billing tools, and spreadsheets through pre-built integrations. Modern platforms support 500+ connectors, so teams skip custom ETL development entirely.
Processing and query layer handles data transformation, aggregation, and analysis. This layer validates metrics against defined business logic and maintains data governance through semantic models.
Visualization layer generates dashboards, charts, and reports automatically. Users customize visuals through drag-and-drop interfaces or natural language commands.
AI/NLP interface is the latest development: platforms that let users ask questions in plain English and receive validated insights without writing SQL. This layer interprets questions, explores data, and surfaces findings proactively.
The global cloud analytics market reached $35.39 billion in 2024 and is projected to hit $130.63 billion by 2030, growing at 25.5% annually. This explosive growth mirrors broader enterprise software trends—CRM, ERP, and now BI all shifting to the cloud.
SaaS BI vs. Traditional On-Premise BI
Traditional BI carries significant overhead before a single dashboard goes live:
- Hardware procurement and dedicated IT staff required from day one
- Implementation cycles of 6 to 18 months before meaningful output
- Upfront capital expenditure on servers, plus per-seat licensing that scales expensively
- Manual patching for updates; scaling compute means buying additional hardware months ahead
SaaS BI removes most of that burden. Subscription pricing converts capital expenditure into predictable operating costs, and vendor-managed infrastructure means no maintenance overhead. Teams connect data sources, configure dashboards, and start analyzing within a week—not a quarter.
Cloud migrations return $3.86 for every dollar spent, driven by eliminating hardware costs and reallocating IT personnel to higher-value work. The shift parallels broader cloud adoption—70.4% of ERP deployments now run in the cloud, with 78.6% of new implementations choosing cloud over on-premise.
AI-native SaaS BI platforms take this further. Rather than just visualizing data, they actively analyze it, validate assumptions, and surface insights without requiring SQL knowledge or dedicated analyst support. Users ask questions conversationally and receive explained findings grounded in governed data models—not just charts.
Key Features to Know
Those capabilities rest on a consistent set of platform features. Most modern SaaS BI tools include:
- Real-time data refresh – Dashboards update continuously as source systems change, eliminating stale reports
- Multi-source integration – Connect databases, SaaS apps, spreadsheets, and APIs through pre-built connectors
- Self-service dashboards – Business users build and customize visualizations without IT assistance
- Role-based access control – Granular permissions ensure users see only authorized data
- Embedded analytics – Dashboards integrate directly into websites, products, or internal portals
- Automated reporting and alerts – Schedule reports to email or Slack; receive notifications when metrics spike or drop
Together, these capabilities mean finance, marketing, operations, and executive teams can run their own analyses—without routing every question through a data analyst or waiting days for a report.
Key Benefits of SaaS Business Intelligence
Lower total cost of ownership: SaaS BI eliminates capital expenditure on servers and reduces IT overhead dramatically. Organizations shift from unpredictable hardware refresh cycles and maintenance costs to predictable monthly subscriptions. Tableau delivers 587% ROI with payback under three months, while Microsoft Power BI returns 366% ROI within six months. These returns stem from faster deployment, reduced IT staffing needs, and immediate productivity gains across business teams.
Faster time to insight: Cloud deployment cuts deployment timelines sharply. Traditional on-premise BI implementations historically required 6 to 18 months for full deployment, including hardware procurement, software installation, ETL pipeline development, and user training.
SaaS BI platforms go from sign-up to first dashboard in hours or days. Teams connect data sources through pre-built integrations, generate initial dashboards automatically, and begin exploring data immediately—no infrastructure setup required.
Accessibility for non-technical users: Self-service analytics represents a major benefit. Business users in marketing, finance, and operations explore data without waiting on data analysts. Despite heavy analytics investments, active BI usage remains stuck at 25% of employees on average. The primary driver increasing adoption is self-service authoring tools (cited by 73% of organizations), followed by data preparation capabilities (48%).
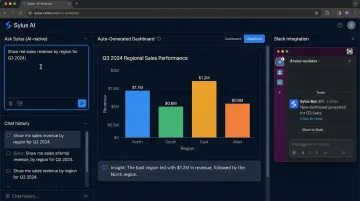
Modern AI-native platforms like Sylus eliminate technical barriers entirely. Users connect data sources and ask questions in plain English—"Show me my top customers" or "What were total sales by rep last quarter?"—receiving validated answers and ready-to-share dashboards without writing SQL. This democratizes data access across organizations, enabling everyone from sales reps to executives to make data-driven decisions independently.
Scalability without infrastructure headaches: SaaS BI scales compute and storage automatically as data volumes and user counts grow. The global datasphere is projected to reach 181 zettabytes by 2025. Handling this growth through on-premise infrastructure requires constant capacity planning and hardware upgrades. Cloud platforms decouple storage from compute, scaling resources instantly during peak usage without performance degradation.
Fast-growing startups and enterprises onboarding new teams benefit most from this flexibility. Platforms offering unlimited-seat models decouple cost from headcount, allowing organizations to expand user access without triggering automatic price increases—removing a common friction point in enterprise software adoption.
Automatic updates and security: Vendors handle updates, patches, and compliance certifications continuously. Teams always use the latest features without scheduling maintenance windows or testing upgrades. Enterprise-grade SaaS BI tools carry compliance certifications—SOC 2 Type II, HIPAA—that would cost most companies $20,000 to $150,000 to achieve independently. Using a compliant vendor lets organizations bypass these audit costs while maintaining security and regulatory compliance.
Top SaaS Business Intelligence Tools
The right SaaS BI tool depends on five key criteria:
- AI/NLP capabilities — how well it handles natural language queries and automated insight generation
- Data connector ecosystem — breadth of native integrations with your existing sources
- Governance features — consistent metric definitions and access controls across teams
- Ease of use for non-technical users — self-service access without SQL or coding knowledge
- Pricing model — per seat, per usage, or custom enterprise
Pricing structures vary widely, and total cost of ownership matters more than sticker price. Per-seat models penalize adoption as teams grow; usage-based or unlimited-seat models scale more favorably.
Sylus
Sylus is an AI-native SaaS BI platform built for modern data teams. Users connect existing data sources and ask questions in plain English, receiving validated insights, auto-generated dashboards, and scheduled reports delivered to email or Slack. The platform roots all analysis in dbt models and documentation, keeping metric definitions consistent and validated across the organization.
Standout differentiators:
- No per-user costs — pricing scales with usage, not headcount, so adoption grows without budget friction
- Conversational querying — ask questions in plain English; the AI validates assumptions before returning findings, no SQL required
- dbt-grounded governance — all analysis runs against your existing dbt models and documentation, enforcing consistent business logic
- SOC 2 Type II and HIPAA compliance – Enterprise-grade security and privacy controls for regulated industries
- Self-hosted deployment option – Organizations can deploy in air-gapped environments for maximum data control
- IP protection policy – Neither Sylus nor model partners train models on customer data, protecting proprietary information
- Slack integration – Query data directly from Slack using commands like "@sylus show me my top customers" and receive charts instantly
Sylus serves both audiences: business users get instant answers through conversational queries, while data engineers use the dbt governance layer and SQL Copilot for query optimization.
The platform is trusted by fast-growing startups through Fortune 1000 enterprises — OpenAI is among its marquee customers.
Tableau
Tableau leads on rich, customizable data visualization. The platform offers an extensive connector library, a large community for support and knowledge sharing, and powerful visual exploration capabilities. Tableau pricing ranges from $15-$35/month for Viewer licenses to $75-$115/month for Creator licenses, with role-based subscriptions requiring at least one Creator license per deployment.
Where it excels: Strong automated insights, robust data preparation, and visual-based exploration that suits analysts who think spatially. Best for teams with dedicated analysts who can navigate its complexity.
Limitations: Steep learning curve for non-technical users, high license costs that grow expensive at scale, and no native write-back capabilities. The complex product portfolio can overwhelm smaller teams.
Microsoft Power BI
Power BI suits organizations already standardized on the Microsoft ecosystem. Power BI Pro costs $14/month per user, with Premium Per User at $24/month—significantly lower than competitors. The platform integrates deeply with Azure, Excel, Teams, and other Microsoft services, with frequent feature updates and competitive new capabilities.
Where it excels: Dominant market presence, strong Copilot AI integration, and deep ties to the Microsoft Fabric analytics stack. The natural choice for Microsoft-first organizations.
Limitations: Less intuitive for teams outside the Microsoft ecosystem. Advanced features require DAX (Data Analysis Expressions) knowledge, creating a technical barrier. Recent price increases and workload isolation issues on shared capacities affect some deployments.
Looker
Looker (Google Cloud) takes a semantic-layer-first approach through LookML, a modeling language that ensures consistent metric definitions across the organization. Data engineering teams define metrics once in LookML, then business users query those governed metrics repeatedly—ensuring everyone calculates "revenue" or "churn" identically.
Where it excels: Robust open architecture, API-first design for embedding analytics, and strong governance through centralized semantic modeling. Ideal for organizations where metric consistency is non-negotiable.
Limitations: Premium pricing and a steep learning curve restrict self-service adoption by non-technical stakeholders. Most organizations find Looker difficult to adopt outside of engineering teams without significant enablement investment.
Domo
Domo offers a full-stack SaaS BI platform combining data integration (ETL), visualization, and AI-assisted insights in one product. The platform features Magic ETL for data preparation, over 1,000 native connectors, and Domo Everywhere for embedding analytics in portals and applications.
Where it excels: Data connection and preparation capabilities replace separate ETL tools entirely. Built for enterprise scale, targeting line-of-business owners and frontline users who need a single vendor for the full data pipeline.
Limitations: Complex consumption-based pricing makes cost forecasting difficult. Natural language query features lag AI-native competitors. The breadth of features adds overhead for smaller teams seeking simpler solutions.
Real-World SaaS BI Examples
SaaS/Subscription Metrics Tracking
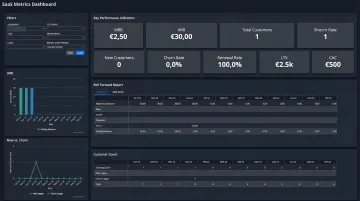
A SaaS company connects billing data (Stripe), CRM data (Salesforce), and product usage analytics into a single dashboard monitoring MRR, ARR, customer churn rate, LTV, and CAC in real time. By building customer-month grain tables and using DAX calculations, the team tracks MRR movements—New, Expansion, Contraction, Churned—and CAC payback periods.
This eliminates hours of manual reporting each week. Churn risks that once took days to surface now appear in hours, enabling proactive retention interventions before customers cancel.
Marketing and Sales Pipeline Analysis
A revenue team uses SaaS BI to consolidate sales activity and pipeline data from HubSpot into unified dashboards. The system tracks booked meetings, calls, deal progression by sales rep, and funnel conversion rates, helping sales leaders identify leading indicators of future revenue.
Automated alerts flag sudden drops in lead quality or conversion rates before they impact quarterly targets. Sales leaders act on live CRM data rather than waiting for lagging monthly reports.
Operations and Product Performance
A product team monitors feature adoption, user retention cohorts, and support ticket volume alongside infrastructure costs. Using cohort retention charts that group users by sign-up month, the team tracks how many remain active in subsequent months.
This drives data-driven roadmap prioritization without waiting on monthly analyst reports. Product managers see directly whether a product change or onboarding update improved long-term retention for a given cohort.
How to Choose the Right SaaS BI Tool for Your Business
Match the Tool to Your Team's Technical Profile
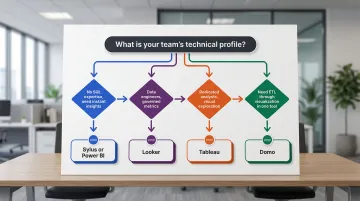
A team without dedicated data engineers needs a self-service, low-code, or AI-driven platform. Sylus and Power BI both serve this segment well — Sylus through natural language queries, Power BI through familiar Excel-like interfaces. A team with strong SQL and data modeling skills may extract more value from Looker's semantic layer or Tableau's advanced analytics.
Decision framework:
- If your team lacks SQL expertise and needs instant insights → Consider Sylus or Power BI
- If you have data engineers who want governed metrics and reusable definitions → Consider Looker
- If you need rich visual exploration and have dedicated analysts → Consider Tableau
- If you want an all-in-one platform handling ETL through visualization → Consider Domo
Evaluate Data Source Compatibility and Governance
Check that the tool connects natively to your existing data warehouse, CRM, and billing systems. For regulated industries — healthcare, fintech — verify compliance certifications. SOC 2 Type II and HIPAA are baseline requirements for handling sensitive data.
Also confirm whether the vendor trains models on customer data. Platforms like Sylus commit that neither they nor their model partners train on customer data, which matters for enterprises handling proprietary or regulated information.
Consider Total Cost of Ownership at Scale
Analyze how pricing grows as your team and data volumes increase. Per-seat models penalize adoption — adding users triggers automatic cost increases that create budget friction. Usage-based or unlimited-seat models allow organizations to expand access without proportional cost growth.
Trial tools with real data before committing. Gather feedback from both the data team members who will configure the platform and the business stakeholders who will use it daily. 80% of data migration and integration projects fail to meet their objectives due to inadequate planning and poor communication — test thoroughly with your actual data landscape before signing any contracts.
Frequently Asked Questions
What is SaaS BI?
SaaS BI (Software-as-a-Service Business Intelligence) is cloud-hosted analytics software that allows companies to connect data sources, analyze data, and visualize insights via a browser—without managing on-premise hardware or infrastructure. The vendor handles security, updates, and scaling while users access dashboards and reports through web interfaces.
What are the top SaaS BI tools?
Leading platforms include Sylus (AI-native with unlimited seats and natural language queries), Tableau (visual exploration standard), Power BI (Microsoft ecosystem integration), Looker (semantic governance through LookML), and Domo (all-in-one data pipeline). The right fit depends on team size, technical expertise, and whether you prioritize AI-powered self-service or developer-controlled governance.
What are SaaS BI tools used for?
Primary use cases include tracking KPIs and subscription metrics (MRR, ARR, churn), building executive dashboards, spotting churn signals early, forecasting revenue from pipeline data, and giving non-technical teams direct access to data for self-service exploration.
How is SaaS BI different from traditional BI?
SaaS BI offers cloud delivery, subscription pricing, and deployment measured in days versus the long implementation cycles (6-18 months), hardware costs, and IT dependency of traditional on-premise BI systems. Cloud platforms scale automatically, update continuously, and eliminate capital expenditure on servers, so teams get answers faster at a lower overall cost.
What should I look for when choosing a SaaS BI tool?
Evaluate data connector coverage, ease of use for non-technical users, AI/NLP query capabilities, compliance certifications (SOC 2, HIPAA), and pricing scalability as your team grows. Always trial with real data and collect feedback from both technical and business users before committing.
Do SaaS BI tools require coding or SQL knowledge?
It depends on the tool. Legacy platforms like Looker favor SQL-proficient users who can write LookML models. Modern AI-native BI tools like Sylus allow users to ask questions in plain English and receive validated insights without writing any code—democratizing data access for marketing, finance, and operations teams who lack technical backgrounds.