Introduction
Data analysts, operations leads, and business users spend 60–80% of their time on manual reporting—pulling data, reconciling numbers, and formatting outputs before sending them off. This repetitive cycle drains productivity and delays decision-making, leaving stakeholders waiting for insights while analysts stay stuck in distribution mode.
Scheduled reports eliminate this bottleneck. They're automated systems that generate and distribute reports at predefined intervals — daily, weekly, monthly — without anyone logging in, running a query, or hitting send. When configured correctly, they deliver key metrics to the right people, consistently and on time.
Poor configuration is a different story. Wrong time zones, static date filters, or over-scheduled distributions turn automation into inbox noise rather than actionable insight.
This guide covers what scheduled reports are, how to configure them step by step, and what separates a well-designed schedule from a poorly executed one — so your recipients get reports they can actually use.
Key Takeaways
- Scheduled reports automatically generate and distribute data at set intervals, keeping stakeholders aligned without manual effort
- Setup involves defining the report, configuring frequency and recipients, choosing output format, and enabling the schedule
- Time zones, dynamic filters, delivery channels, and skip-if-empty settings determine whether your schedule delivers signal or noise
- Platforms like Sylus add AI-generated summaries to scheduled reports, so stakeholders get analysis, not just numbers
What Is a Scheduled Report?
A scheduled report runs automatically at a set time and cadence, pulling live or filtered data and delivering it to designated recipients via email, Slack, or storage — no manual action required. The result: stakeholders get consistent, timely snapshots of key metrics without anyone needing to touch the system.
How scheduled reports differ from live dashboards:
Dashboards are interactive and always-on, reflecting real-time data on demand. Users pull them up to explore metrics, drill into details, or answer ad hoc questions.
Scheduled reports work differently — they're point-in-time snapshots pushed to recipients automatically at fixed intervals. They're built for structured review cycles, not open-ended exploration:
- Weekly team performance check-ins
- Monthly executive summaries
- Daily operational metrics
Why Scheduled Reports Matter for Modern Data Teams
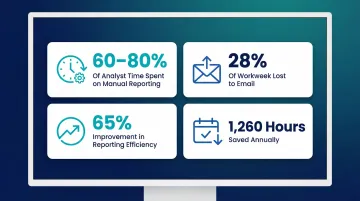
Analytics teams spend 60% to 80% of their time on manual reporting tasks — and the average knowledge worker burns 28% of their workweek on email alone. Automating report distribution reclaims that time directly. A Forrester study on Workday Prism Analytics found organizations improved reporting efficiency by up to 65% through centralized data and fewer manual reconciliations, with some teams saving 1,260 hours annually on ad hoc reports.
What teams risk without scheduled reports:
- Delayed decisions due to stale data sitting in someone's queue
- Inconsistent reporting across stakeholders, with different people seeing different versions
- Analysts spending their time on distribution instead of analysis, cutting capacity for strategic work
Modern platforms go beyond static delivery. Sylus, for example, attaches AI-generated summaries to scheduled reports sent via email or Slack — so recipients get both the data and a plain-English explanation of what changed and why. This cuts follow-up analysis meetings and helps non-technical stakeholders act on insights without waiting for an analyst to walk them through it.
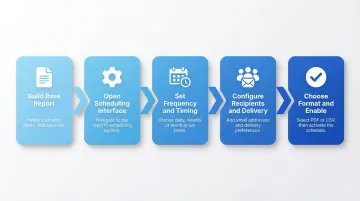
How to Create a Scheduled Report: Step-by-Step
Most reporting tools follow a universal creation flow, regardless of platform—whether you're using an enterprise BI tool, a CRM, or a dedicated analytics platform like Sylus. Here's the step-by-step process:
Step 1: Build and Save the Base Report
Before scheduling anything, the underlying report must exist and be saved. This means:
- Define the data source or table you're pulling from
- Apply necessary filters and conditions (date ranges, status filters, department filters)
- Choose the visualization type (list, bar chart, pie chart, table)
- Confirm the report returns expected output by running it manually
A poorly defined base report will produce a poorly scheduled one. If your filters are too broad, recipients get irrelevant data. If your date range is static, the report becomes stale immediately. Test thoroughly before scheduling.
Step 2: Open the Scheduling Interface
Access scheduling settings through your platform's interface. The location varies by tool:
- Salesforce: Click "Subscribe" from the Reports tab or report run page
- Power BI: Select "Subscribe" from the top menu bar, then "Create a subscription"
- Tableau: On the view toolbar, select "Watch > Subscriptions"
- ServiceNow: Navigate to "All > System Definition > Scheduled Jobs," select "New," then "Automate the generation and distribution of a report"
In most platforms, you'll find scheduling under "Share," "Actions," or "Schedule" menus.
Step 3: Set the Frequency and Timing
Configure when and how often the report runs:
- Run frequency: Daily, weekly, monthly, or custom intervals
- Specific days: For weekly reports, choose Monday vs. Friday; for monthly, choose the 15th vs. last day
- Preferred start time: Consider recipient time zones and when they review reports
- Start/end date range: Set when the schedule begins and optionally when it expires
Practical pitfall: Scheduling on the 31st of each month will skip months with fewer days (February, April, June, September, November). Use "last day of month" options when available, or schedule for the 28th to ensure consistent delivery.
Step 4: Configure Recipients and Delivery Channel
Add recipients by email address or user account. Some platforms restrict recipients to internal users only; others allow external email addresses. Check recipient access requirements before the first scheduled run to avoid delivery failures.
Delivery channel options:
- Email: Direct inbox delivery with attachments or inline HTML
- Slack: Integration with team channels for real-time visibility
- Storage: Automated save to shared folders or cloud storage
Platforms like Sylus support both email and Slack delivery, so teams receive reports in the tools they already use.
Step 5: Choose Output Format and Enable the Schedule
Select the appropriate output format based on how recipients will use the data:
- PDF: Presentation-ready delivery for executives or external stakeholders
- CSV: Downstream data processing, imports into other systems
- XLS/XLSX: Spreadsheet analysis with formulas and pivot tables
- HTML: Inline email reading without attachments
Best practice: Enable "only send non-empty reports" to prevent empty report emails when no data matches your filters. This reduces notification fatigue and ensures recipients only see reports with actionable information.
Confirm by enabling/activating the schedule and saving. Verify the schedule appears in your platform's "Scheduled Jobs" or "Subscriptions" view.
Key Configuration Settings to Get Right
Time Zone Alignment
Scheduled reports run in the time zone of the configuring user by default in most platforms. This causes delivery timing mismatches for distributed teams—a report scheduled for 8:00 AM EST arrives at 5:00 AM PST, missing the intended review window.
Best practice: Explicitly set and confirm the intended time zone during configuration. Power BI normalizes dates to UTC for "After data refresh" subscriptions. Tableau defaults to UTC for extract-based data sources. Verify your platform's behavior and adjust accordingly.
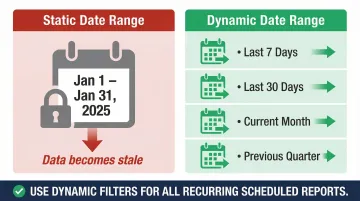
Filters and Conditions
The report's filter set at the time of scheduling is what runs automatically. If you use a static date range (e.g., "January 1 - January 31, 2025"), the report will continue delivering that same month's data indefinitely.
Dynamic date ranges solve this. Rolling filters automatically advance with the calendar — common options include:
- Last 7 days or last 30 days
- Current month or previous month
- Previous quarter or year-to-date
Verify your platform supports rolling date logic before scheduling — not all tools do.
Recipient Permissions and Access
Some platforms require recipients to have access to the report folder or underlying data before they can view delivered reports. If permissions aren't validated before the first scheduled run, recipients receive emails with broken links or access denied errors.
Validation steps:
- Confirm recipients have appropriate system roles or licenses
- Test delivery to one recipient before rolling out to full distribution lists
- Check platform-specific requirements (e.g., ServiceNow requires specific "report_scheduler" roles)
Output Format and File Size Limits
Many platforms impose file size caps on emailed reports:
- Salesforce: 10 MB for emailed reports, 3 MB (15,000 rows) for subscription attachments
- Power BI: 25 MB maximum attachment size, limited to 20 pages for paginated reports
Before scheduling large reports, reduce scope to stay within these limits:
- Filter rows to essential data only
- Remove unused columns
- Split large reports into multiple smaller scheduled reports
Verification After Setup
Confirm the scheduled report is active and queued correctly through your platform's "Scheduled Jobs" or "Subscriptions" view. Recommended verification steps:
- Send a test run immediately after setup
- Check execution logs after the first scheduled run
- Monitor for delivery failures or error notifications
- Review recipient feedback to ensure reports are arriving as expected
Best Practices and Common Mistakes
Three Most Common Mistakes
- Scheduling reports no one reads — teams set up automation once, never audit who actually opens them, and recipients stop engaging entirely
- Using static date filters — reports don't roll forward, so they gradually become meaningless as they keep delivering January's data in June
- Over-scheduling — too many reports to too many people creates inbox noise instead of actionable communication
Best Practices for Report Cadence Design
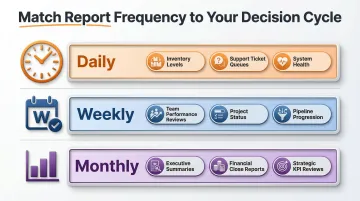
Align frequency to the decision cycle the report supports:
- Daily: Operational metrics requiring immediate action (inventory levels, support ticket queues, system health)
- Weekly: Team performance reviews, project status updates, pipeline progression
- Monthly: Executive summaries, financial close reports, strategic KPI reviews
Avoid defaulting to daily delivery for reports stakeholders only act on weekly. According to research, the average worker receives over 100 emails daily, and internal corporate emails carry a significant unread rate. Every scheduled report should earn its place in the inbox.
Scheduling a report is not the same as having a reporting strategy. Content, audience relevance, and downstream action matter more than the automation itself — a well-scheduled irrelevant report is still a waste of attention.
When Scheduled Reports Aren't Enough
Traditional scheduled reports fall short in two common scenarios.
First, when stakeholders need to ask follow-up questions, static delivery doesn't help. A spike in churn or unexpected revenue variance requires context that raw numbers don't provide — recipients can only consume what's delivered, not explore it.
Second, when reports contain anomalies, stakeholders without analytical fluency struggle to act. Is the spike in customer acquisition a successful campaign or a data quality issue? Is the drop in support tickets a sign of product improvement or underreporting?
In both cases, scheduled reports push data but don't explain it. Analysts still need to review deliveries, flag anomalies, and clarify findings in follow-up meetings — the manual effort that scheduling was supposed to eliminate.
That gap is where AI-generated summaries change the equation. Platforms like Sylus let teams schedule not just reports but plain-English explanations alongside them, delivered to email or Slack. Stakeholders receive the data and the context: what changed, what drove it, and what it might mean.
For example, instead of receiving a table showing a 23% increase in customer churn, recipients get: "Customer churn increased 23% this week, driven primarily by enterprise accounts in the healthcare vertical. This coincides with the January pricing change rollout in that segment." Recipients can act on it without waiting for analyst follow-up.
Gartner predicts that by 2027, 75% of new analytics content will use generative AI to add context, creating tighter connections between insights and action. The question shifts from "how do we deliver reports?" to "how do we ensure recipients can act on them?"
Conclusion
Scheduled reports are a foundational automation that eliminates manual report distribution and keeps stakeholders consistently informed on key metrics. When configured correctly—with appropriate frequency, dynamic filters, accurate time zones, and validated permissions—they reclaim analyst time and accelerate decision-making across the organization.
Getting the configuration details right at setup determines whether scheduled reports deliver real value or become ignored inbox noise. Review your existing schedules regularly against three questions:
- Are recipients actually opening and acting on the reports?
- Do the filters still reflect how the business is segmented?
- Is the cadence aligned with when decisions actually get made?
As data teams mature, the question shifts from "how do we deliver reports?" to "how do we ensure recipients can act on them?" That's where pairing scheduled delivery with AI-generated summaries closes the gap — tools like Sylus can attach an interpreted narrative to each report so recipients get the "what happened and why" alongside the numbers, not just the data itself.
Frequently Asked Questions
What is a scheduled report?
A scheduled report is an automatically generated and distributed report that runs at a predefined time and cadence—daily, weekly, or monthly—without requiring manual action from the user. It pulls current data based on saved filters and delivers it to designated recipients via email, Slack, or storage.
What is the primary function of a scheduled report?
Its primary function is to ensure consistent, timely delivery of key data and metrics to the right stakeholders, removing the need for someone to manually run and share the report each cycle. This automation keeps teams aligned on performance without requiring analyst intervention for routine distribution.
How often should I schedule a report?
Frequency should match the decision cycle the report supports. Operational metrics warrant daily delivery when teams act on them immediately. Team performance reviews suit weekly cadences. Executive summaries and financial reports are typically best sent monthly, aligning with board meetings or strategic planning cycles.
What's the difference between a scheduled report and a live dashboard?
A live dashboard is interactive and reflects real-time data on demand, allowing users to explore, filter, and drill into details whenever needed. A scheduled report is a point-in-time snapshot pushed to recipients automatically at fixed intervals, making it better suited for structured review cadences than open-ended exploration.
Can I send scheduled reports to people outside my organization?
It depends on the platform. Some tools restrict delivery to registered users or require specific roles, while others—like Sylus—support flexible sharing with external stakeholders via email invitation or shareable links. Verify recipient access settings before the first scheduled run to avoid delivery failures.
What file formats are typically supported for scheduled reports?
The most common formats are PDF (for presentation-ready delivery), CSV (for downstream data processing), XLS/XLSX (for spreadsheet analysis), and HTML (for inline email display). Choose the format based on how recipients intend to use the data.