Introduction
Most data analysts spend 60-80% of their time gathering, cleaning, and formatting data — not analyzing it. That means highly paid professionals dedicate fewer than four out of every 10 working hours to actual insights and strategic modeling.
The cost adds up fast. Organizations lose an average of 9.1 hours per analyst per week to manual reporting inefficiencies, totaling over $21,000 in wasted productivity annually per employee.
Automated report generation directly addresses this bottleneck. Modern systems pull data from connected sources, process it against governed business logic, and deliver finished reports or dashboards without manual intervention. What separates today's platforms from older rule-based tools is AI. Instead of following rigid scripts, modern automated reporting can:
- Answer natural language questions about your data
- Reason through results and validate assumptions
- Surface insights proactively, before anyone thinks to ask
That shift moves reporting from a mechanical task your team manages to an intelligent process that works alongside them.
Key Takeaways
- Automated report generation uses AI-powered software to handle data collection, analysis, and delivery — no manual effort required
- Analysts waste 60-80% of their time on manual data prep instead of strategic analysis, costing over $21,000 per employee annually
- AI-native tools outperform legacy RPA by understanding natural language and validating assumptions before delivering results
- Teams reclaim 9+ hours per analyst weekly with a 94% reduction in spreadsheet errors
- Real-time decision-making becomes possible when data access is no longer gated by technical skill
- Choose tools offering broad data connectivity, governed semantic layers, enterprise security (SOC 2, HIPAA), and unlimited-seat pricing
What Is Automated Report Generation?
Automated report generation is the use of software to automatically collect data from one or more sources, transform it according to business logic, and produce formatted, shareable reports on a schedule or on demand—without requiring a human to manually build each deliverable.
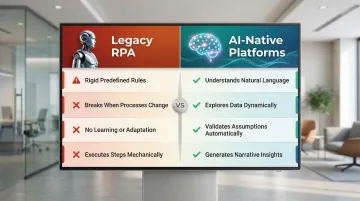
The technology has evolved through distinct phases. Early automation relied on scripted jobs and Robotic Process Automation (RPA) bots that replicated human clicks through legacy systems. RPA works well for extracting data from static sources and shuttling it between systems, but the approach has hard limits:
- Operates on rigid, predefined rules
- Breaks when underlying processes change
- Cannot learn, adapt, or reason about data
- Executes steps mechanically without validation
Those limitations are exactly what AI-native platforms are built to overcome. Instead of following fixed scripts, they understand natural language queries ("What were our top 5 revenue drivers last quarter?"), explore data dynamically, validate assumptions before returning results, and generate narrative summaries alongside visualizations.
The distinction matters in practice. A scheduled weekly CSV emailed to stakeholders is automation. An AI system that explores your data, surfaces anomalies, contextualizes findings within your business definitions, and delivers actionable insights is something different—it's analysis.
The Real Cost of Manual Reporting
The Hidden Productivity Drain
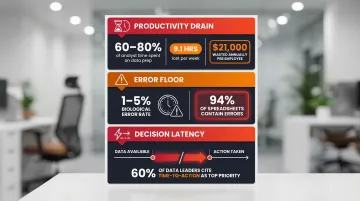
Studies show analysts spend between 60% and 80% of their time finding, gathering, and preparing data — leaving fewer than four working hours out of every 10 for actual analysis. Each analyst loses roughly 9.1 hours per week to these inefficiencies, totaling over $21,000 in wasted productivity annually.
The financial damage scales up quickly at the organizational level. Manual data entry and poor data quality cost companies an average of $12.9 million per year, with lost productivity running approximately $28,500 per employee annually.
The 1-5% Biological Error Floor
Manual reporting introduces unavoidable human error. The accepted average error rate for manual data entry is approximately 1% to 5%—a biological floor that persists even under ideal conditions. When performing straightforward mechanical tasks, humans commit errors at around 0.5%, but this rate rises to 5% for complex activities. As a result, 94% of audited operational spreadsheets contain significant errors.
Copy-paste mistakes, stale data, and version conflicts compound when multiple stakeholders maintain separate spreadsheets. The consequences can be catastrophic:
- JPMorgan's $6.2B trading loss (2012): A formula in an Excel-based Value-at-Risk model divided by a sum instead of an average, understating risk and resulting in massive losses
- Edinburgh Hospital's £16M delay: A data entry error in a 2012 spreadsheet led to incorrect ventilation specifications, delaying the hospital's opening and requiring extensive remedial work
The Decision Latency Bottleneck
Beyond direct financial loss, manual reporting creates decision latency—the time lag between data availability and action. When reports can only be produced by technical staff (data analysts, engineers), business users wait days for answers, slowing decision-making cycles. In a 2024 Gartner survey, over 60% of data leaders ranked "reducing time to action" as their top priority for analytics investments.
Every hour spent assembling reports is an hour not spent on analysis, strategy, or decisions that move the business forward. That gap — between data availability and action — is exactly what automated reporting is designed to close.
How AI-Powered Automated Report Generation Works
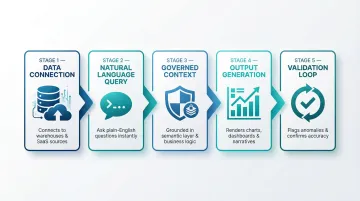
Connecting to Live Data Sources
The foundation of automated reporting is connecting to data sources—databases, cloud warehouses (Snowflake, BigQuery, Redshift), SaaS tools, and spreadsheets—so the system always has access to fresh, accurate data rather than static exports. This eliminates manual data pulls and ensures reports reflect current reality.
Natural Language Query and Exploration
Modern AI systems allow users to ask questions in plain English: "What were our top 5 revenue drivers last quarter?" The AI translates intent into queries, explores the data, and validates assumptions before returning results. This contrasts sharply with older tools that require SQL expertise or predefined templates.
For example, a sales manager can type "Show me month-over-month performance by rep" and receive a formatted dashboard in seconds—no technical intermediary required. The AI reasons through the data, selects appropriate visualizations, and surfaces key findings automatically.
Governed Context: Grounding Analysis in Business Logic
A critical differentiator in AI-powered reporting is governed context—grounding analysis in documented business definitions to ensure consistent metric definitions across the organization. Without this, different departments calculate metrics like "revenue" using different methods, leading to conflicting reports and mistrust.
Platforms built on semantic layers (such as dbt models and documentation) ensure every analysis references the same source-of-truth definitions your team already uses. For instance, Sylus grounds all analysis and exploration in dbt models, meaning every query, dashboard, and AI-generated summary uses the same validated business logic. This means a finance team and a sales team pulling the same revenue metric will always see the same number—no reconciliation calls, no competing spreadsheets.
Output Generation: Charts, Dashboards, and Narrative Summaries
Once the AI explores the data, it renders results as charts, dashboards, or narrative summaries. Modern systems don't just display raw data—they contextualize findings, highlight anomalies, and generate insights in natural language. Users can customize visualizations with plain English instructions ("make this chart Christmas-themed"), with no technical formatting knowledge required.
Scheduling and Delivery
After a report or dashboard is generated, automated systems push it to stakeholders on recurring schedules via email, Slack, or embedded links in internal tools. Teams can configure report frequency to match organizational needs—daily pipeline updates, weekly performance reviews, or monthly executive briefings—so findings land in inboxes automatically, without anyone manually pulling or distributing data.
The Validation Loop
AI-powered systems introduce a validation loop that simple automation scripts lack. Before returning final deliverables, the AI can flag anomalies, surface unexpected data patterns, and prompt teams to verify metrics collaboratively. Teams catch errors before they reach stakeholders—not after a VP asks why two reports show different numbers.
Key Benefits of Automated Report Generation
Faster, Real-Time Decision-Making
Automated systems generate reports in seconds from live data connections, meaning business leaders make decisions based on current reality rather than data that is days or weeks old. A global MIT CISR study found that companies operating in the top quartile of "real-time-ness" achieved more than 50% higher revenue growth and net margins compared to slower counterparts. These organizations empower people and systems to use trusted data to respond immediately to changing conditions.
Reduced Human Error and Greater Accuracy
Removing manual steps—data pulls, copy-paste, formula building—from the reporting pipeline reduces error risk. Automated pipelines apply consistent logic every time, unlike human-built reports that can drift. By eliminating the 1-5% biological error floor inherent in manual data entry, organizations dramatically improve data quality and prevent costly mistakes.
Direct Data Access for Every Team
When reports can be generated via plain English questions or shared dashboards—rather than requiring SQL skills—non-technical business users in marketing, finance, and operations gain direct access to insights without depending on the data team as an intermediary.
Historically, self-service analytics adoption stalled around 20% for years. AI and natural language querying are breaking that ceiling: organizations implementing NLQ interfaces report a 63% increase in self-service analytics adoption among non-technical teams.
Scalability Without Headcount
As data volume and stakeholder counts grow, automated reporting keeps pace—no new analyst hires required. This is especially relevant for fast-growing startups and lean data teams operating under resource constraints. By reclaiming 9.1 hours per analyst per week previously lost to manual reporting, teams can focus on strategic modeling and high-value analysis while serving far more stakeholders.
Top Use Cases Across Teams and Industries
Finance and Operations
Finance teams use automated reporting for recurring deliverables: monthly close reports, budget vs. actuals, cash flow summaries, and audit documentation. The productivity gains are substantial:
- Echelon Home Products (wholesale distributor) saved 20 hours per week by automating 110 weekly and 71 monthly SAP Crystal Reports, eliminating network slowdowns and recovering the equivalent of half an IT salary
- Manufacturing organizations deploying automated financial management reported 20–50% reductions in effort for finance team members, saving $341,000 over three years
- Accounts payable managers using automated finance platforms saved 480 hours per year on core accounting tasks
Sales and Marketing
Sales teams use automated dashboards to track pipeline health, conversion rates, and quota attainment in real time. Marketing teams automate campaign performance reports across channels — cutting reporting lag so teams can act on data the same week it's collected.
Nestlé faced significant bottlenecks with manual reporting — brand managers waited up to two weeks for simple market insights. By implementing self-service analytics with automated reporting, Nestlé achieved:
- 75% reduction in report generation time (from 14 days to 3.5 days)
- 18x faster decision-making
- 60% drop in IT support requests

The same reporting gaps that slow marketing decisions also affect sales pipelines. B+M Industrial struggled with manual CRM data entry, leading to delayed follow-ups and poor pipeline visibility. By adopting AI-powered automation, the company captured 10x more information in HubSpot and saved sales reps over 2.5 hours per week on data entry.
Data and Engineering Teams
Data and engineering teams are often the hidden consumers of automated reporting — building the very reports that other teams rely on. Automation shifts that dynamic entirely.
Common use cases include:
- Scheduled data quality checks that flag anomalies before they reach stakeholders
- Pipeline health reports delivered automatically to Slack or email
- Usage metrics and AI-generated summaries distributed without manual prep
- Automated alerts when activity spikes or data thresholds are breached
This removes the bottleneck of ad-hoc stakeholder requests, letting data teams concentrate on infrastructure, modeling, and higher-value analysis instead of assembling decks.
What to Look for in an Automated Reporting Tool
Data Connectivity and Governance
The tool should connect to your existing data sources—cloud warehouses (Snowflake, BigQuery, Redshift), databases, SaaS apps, spreadsheets—and ground its analysis in your semantic layer or documentation (for example, dbt models) to ensure consistent, trustworthy metric definitions. Without governed context, you risk perpetuating the "Tower of Babel" problem where different tools and teams calculate metrics differently.
Scheduling and Delivery Flexibility
Look for tools that support report distribution via multiple channels—email, Slack, embedded links—on customizable schedules, not just manual exports. The best platforms let you configure daily, weekly, or monthly cadences and push insights directly into the workflows where decisions actually get made.
Security and Compliance
For data teams handling sensitive business or customer data, these criteria are non-negotiable:
- SOC 2 Type II certification confirms security controls are both designed well and operating effectively over time
- HIPAA compliance with signed Business Associate Agreements (BAAs) for any platform touching Protected Health Information
- Self-hosted deployment to meet air-gapped environment or strict data residency requirements
- No model training on customer data — your proprietary data should never feed into public LLMs
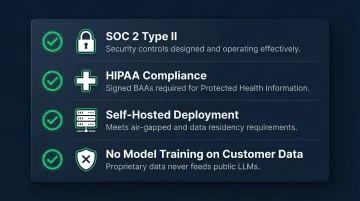
Sylus is built with these enterprise requirements in mind—SOC 2 Type II and HIPAA certified, with a self-hosted deployment option and a strict policy that neither Sylus nor its model partners train models on customer data.
Ease of Use and Scalability
The best tools let both technical and non-technical users get value—through natural language querying and no-code dashboards—without requiring a data engineering background. Equally important: pricing should not penalize growth. Per-seat models create real barriers to adoption as teams scale. Usage-based pricing with unlimited seats lets every team member access data directly, without costs spiraling as headcount grows.
Frequently Asked Questions
What is automated report generation?
Automated report generation is the process of using software to automatically collect data from connected sources, process it according to business logic, and produce formatted reports or dashboards—without requiring manual data pulls, formatting, or distribution by a human.
How does automated report generation save time for data teams?
Automated tools eliminate repetitive tasks like data extraction, spreadsheet formatting, and report distribution—freeing analysts to focus on higher-value interpretation and strategy. Teams typically reclaim 9.1 hours per analyst per week, translating to over $21,000 in annual productivity savings per employee.
What is the difference between RPA-based and AI-powered automated reporting?
RPA tools automate rule-based, repetitive steps (like clicking through a system to pull a report) but break when processes change and cannot learn. AI-powered tools understand natural language questions, reason over data, surface insights proactively, and adapt to new queries—making them far more flexible for teams whose reporting needs shift frequently.
Can automated reports be customized without technical knowledge?
Yes. Modern AI-native reporting tools allow users to customize reports and charts using plain English instructions, without needing SQL or coding skills. Business users in marketing, finance, or operations can self-serve their own analyses, request styling changes conversationally, and generate dashboards independently.
How do I ensure the accuracy of automatically generated reports?
Accuracy depends on data source quality, metric governance, and validation features. Tools built on governed context—such as semantic layers or dbt documentation—ensure every report uses the same agreed-upon business logic, while team verification workflows let stakeholders review and confirm metrics before publishing.
What should I look for in an automated report generation tool?
Key features to prioritize:
- Broad data source connectivity
- Scheduled delivery across channels (email, Slack)
- Natural language querying for non-technical users
- Enterprise security compliance (SOC 2, HIPAA)
- Self-hosted deployment options
- Unlimited-seat pricing that doesn't penalize team growth