Introduction
Organizations generated over 120 zettabytes of data in 2026, yet most struggle to extract meaningful insights quickly enough to stay competitive. According to Mordor Intelligence, the global Business Intelligence market reached $41.16 billion in 2026 and is projected to climb to $62.38 billion by 2031, registering an 8.67% compound annual growth rate. That pressure is landing squarely on data teams.
Not all BI tools are built for that pace. Modern teams need platforms that combine governance, AI capabilities, and accessibility for both analysts and business users — not just dashboards. This guide covers the top BI platforms in 2026 and what to look for based on your organization's data maturity, technical stack, and compliance requirements.
Key Takeaways
- BI tools aggregate, analyze, and visualize data to support faster, evidence-based decisions at every level of your business
- The market now spans traditional visualization platforms and AI-powered analytics tools with natural language querying
- Top selection criteria: ease of use, data stack integration, scalability, AI maturity, and security compliance
- Leading tools include Microsoft Power BI, Tableau, Looker, Qlik Sense, and AI-powered platforms like Sylus, which grounds analysis in your data with natural language querying
- The right fit depends on your technical maturity, data infrastructure, and whether self-service or governed AI analytics better suits your team
What Are Business Intelligence Tools?
Business intelligence tools are software platforms that collect, transform, and visualize data from multiple sources to help teams make evidence-based decisions. Traditional BI focused on dashboards and scheduled reports. Modern AI-driven BI goes further — enabling natural language queries, automated analysis, and predictive insights.
Core BI functions include:
- Data connectivity — pulling from databases, cloud apps, and data warehouses
- Transformation — cleaning and structuring raw data for analysis
- Visualization & dashboards — presenting findings in charts, graphs, and reports
- Conversational analytics — letting users query data in plain English

Modern platforms blur the line between analyst-grade and business-user tooling, giving non-technical stakeholders self-serve access without sacrificing data governance.
Despite these advancements, legacy habits persist. A 2024 Row64 survey found 65% of data analysts still rely on Excel, compared to 46% for Power BI, highlighting the gap between tool availability and adoption. The platforms below cover the most widely adopted BI solutions used by data teams and business users in 2026.
Top Business Intelligence Tools in 2026
These tools were selected based on market presence, feature depth, user adoption, and suitability across team sizes and technical skill levels.
Microsoft Power BI
Microsoft Power BI is a cloud-based BI platform deeply integrated into the Microsoft ecosystem—Excel, Azure, Teams, and SharePoint—making it the natural choice for enterprises already invested in Microsoft tooling. With 30 million monthly active users, it dominates the market.
Its technical edge: strong data modeling via DAX, real-time dashboards, a library of 300+ data connectors, and a free desktop tier that lowers the barrier to entry. Best for teams with Excel fluency, though complex environments require a steeper setup curve. Note that Microsoft increased pricing in April 2025—Power BI Pro now costs $14/user/month, and Premium Per User is $24/user/month.
| Attribute | Details |
|---|---|
| Key Features | Interactive dashboards, DAX modeling language, Power Query for data transformation, natural language Q&A, 300+ data connectors |
| Best For | Mid-to-large enterprises already using Microsoft 365 or Azure |
| Pricing / Deployment | Free desktop version; Power BI Pro ($14/user/month) and Premium tiers available; cloud-native with on-premises gateway option |
Tableau
Tableau, now part of Salesforce, set the benchmark for drag-and-drop interactive visualizations and still leads on visual depth and flexibility. It's been named a Leader in the 2025 Gartner Magic Quadrant and boasts a massive community with over 50,000 authors on Tableau Public.
Where it pulls ahead: industry-leading data visualization capabilities, Tableau Pulse for AI-driven metric summaries, calculated fields, live and extract connections, and embedded analytics. It tends to be more expensive and can require dedicated admin resources at scale.
| Attribute | Details |
|---|---|
| Key Features | Drag-and-drop visual analytics, Tableau Pulse AI summaries, calculated fields, live and extract connections, embedded analytics |
| Best For | Data analysts and business teams that prioritize visual storytelling and exploratory analysis |
| Pricing / Deployment | Subscription-based—Viewer ($15/user/month), Explorer ($42/user/month), Creator ($75/user/month); available as Desktop, Server (on-prem), or Tableau Cloud |
Looker (Google Cloud)
Google's enterprise BI platform, acquired in 2019, is built around LookML—a semantic modeling layer that enforces consistent metric definitions across all reports and dashboards. Looker executes queries directly within cloud data warehouses like BigQuery rather than extracting data into a proprietary BI engine, minimizing data movement and reducing latency for petabyte-scale environments.
The core differentiator: LookML enforces a single source of truth across every report, with native Google Cloud integration, embedded analytics, and Git-based version control. Ideal for data engineering-mature teams that want governed, scalable BI.
| Attribute | Details |
|---|---|
| Key Features | LookML semantic modeling, embedded analytics, Looker Studio integration, Git-based version control, real-time data exploration |
| Best For | Data-engineering-led teams on Google Cloud or those needing a governed semantic layer |
| Pricing / Deployment | Enterprise pricing (contact sales); cloud-native, hosted on Google Cloud |
Qlik Sense
Qlik Sense is a 15-time Gartner Magic Quadrant Leader built on a proprietary associative engine that allows users to explore data freely. Unlike query-based tools, it surfaces relationships across datasets that users didn't explicitly request, enabling multi-directional exploration without predefined query paths.
What sets it apart: the associative data model enables non-linear exploration that query-based tools can't match, paired with Insight Advisor (AI-driven suggestions), augmented analytics, multi-cloud support, and embedded analytics. Strong for complex, multi-source data environments.
| Attribute | Details |
|---|---|
| Key Features | Associative analytics engine, Insight Advisor (AI-driven suggestions), augmented analytics, multi-cloud support, embedded analytics |
| Best For | Enterprises with complex, multi-source data environments that need flexible, non-linear data exploration |
| Pricing / Deployment | Subscription-based (Business and Enterprise tiers); SaaS (Qlik Cloud) or on-premises deployment |
Sylus
Sylus is an AI-native analytics platform trusted by teams including OpenAI, built for modern data teams that want to ask questions in plain English and receive fully validated, dashboard-ready answers grounded in their dbt models and documentation.
The practical upside: rather than requiring users to build queries or configure dashboards manually, Sylus acts as an AI data analyst—it explores data, validates assumptions, and returns shareable dashboards and reports automatically. It offers unlimited seats (usage-based pricing), SOC 2 Type II and HIPAA compliance, self-hosted deployment, and the ability to query data directly from Slack or schedule AI-generated summaries to email.
| Attribute | Details |
|---|---|
| Key Features | Natural language querying grounded in dbt context, AI-generated dashboards, Slack integration, scheduled AI summaries, governed context engine, self-hosted option |
| Best For | Fast-growing startups and F1000 data teams that want governed, AI-powered analytics without per-seat pricing constraints |
| Pricing / Deployment | Usage-based pricing with unlimited seats; cloud or self-hosted; SOC 2 Type II and HIPAA compliant |
How We Chose These BI Tools
These tools were assessed on market adoption, feature depth across core BI functions (connectivity, modeling, visualization, collaboration), scalability across team sizes, and relevance to 2026 data team needs.
A common mistake: over-indexing on UI polish while underweighting governance, security, and long-term total cost of ownership.
The factors that matter most for business outcomes:
- Data stack integration — especially with cloud warehouses and dbt
- Compliance certifications — SOC 2, HIPAA for regulated industries
- AI capability maturity — governed, trusted AI analysis, not just co-pilot features
- Licensing models — pricing that doesn't penalize team growth
According to dbt Labs' 2025 State of Analytics Engineering Report, 27% of data teams are increasing investment in semantic layers to improve AI query accuracy. BI tools must integrate with these semantic layers to prevent AI hallucinations and ensure governance.
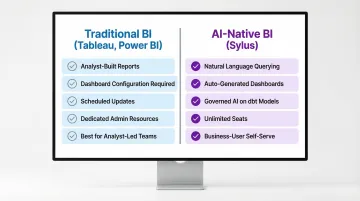
That requirement shapes which tools belong on your shortlist. Traditional visualization tools like Tableau or Power BI suit teams with dedicated analysts who build and maintain reports. AI-native platforms like Sylus are designed for teams where both analysts and business users need answers without building every report from scratch.
Conclusion
The BI landscape in 2026 spans mature visualization platforms to AI-native analytics. The best tool isn't the most popular one—it's the one aligned with your team's workflow, data infrastructure, and governance requirements.
Evaluate tools not just on demo-day experience but on long-term fit:
- How the tool handles data model changes as your schema evolves
- Whether pricing scales without penalizing growth (unlimited seats vs. per-seat models matter here)
- How quickly non-technical stakeholders can get answers without creating analyst bottlenecks
If your team needs governed AI analysis built on your dbt models, plain-English querying, automatic dashboards, unlimited seats, and SOC 2 / HIPAA compliance, get started with Sylus or book a 15-minute demo.
Frequently Asked Questions
What is a business intelligence tool?
A BI tool is software that connects to data sources, processes and analyzes data, and presents insights through dashboards, reports, and visualizations. It enables teams to make data-driven decisions without writing code or running manual queries.
Which BI tool is best for beginners?
Looker Studio and Microsoft Power BI are popular starting points thanks to their drag-and-drop interfaces and free tiers. AI-native tools like Sylus go further, letting users ask questions in plain English rather than building dashboards from scratch.
Are Excel and SQL considered business intelligence tools?
Excel and SQL are foundational data tools but not full BI platforms. BI tools build on top of these capabilities by adding automated data connectors, interactive visualizations, governance layers, collaboration features, and increasingly AI-driven analysis at scale.
What is cloud-based BI?
Cloud-based BI refers to analytics platforms hosted and delivered over the internet rather than on local servers. These tools offer faster deployment, automatic updates, and scalable access across distributed teams without requiring on-premises infrastructure management.
Which BI tools are cloud-based?
Most modern platforms offer cloud-native options: Microsoft Power BI, Tableau Cloud, Looker, Qlik Cloud, and Sylus all qualify. Several also support self-hosted or hybrid deployment for organizations with strict data residency requirements.
What are dashboards in business intelligence tools used for?
Dashboards are interactive interfaces that display key metrics and trends in real time, letting teams monitor performance, spot anomalies, and share insights without running individual queries.