Introduction
Organizations today face a paradox: while 67% have adopted BI tools and 94% rate analytics as critical to success, 67% of enterprise leaders admit their teams frequently ignore dashboards due to data latency and metric overload. Companies are drowning in visualizations yet starving for actionable answers. The challenge isn't lack of data—it's the friction between having data and actually using it to make confident decisions.
The BI software market has evolved dramatically. Traditional visualization platforms like Power BI and Tableau now sit alongside AI-native tools that let anyone ask questions in plain English and get complete, validated analyses in seconds. That shift has made tool selection more complex—and higher stakes—than ever.
This guide covers the top BI tools in 2026, the key evaluation criteria (from data governance to AI depth), and how to match the right platform to how your team actually works—not just what looks good in a demo.
Key Takeaways
- BI software helps organizations collect, analyze, and visualize data to support faster, more confident decision-making
- The market splits between traditional visualization platforms (Power BI, Tableau, Qlik) and AI-native tools like Sylus that let anyone query data in plain English
- Key selection criteria: ease of use, AI capabilities, data governance, and pricing model
- The global BI market will exceed $43 billion in 2026, growing at 9% annually
- The best BI tool is the one your entire team will actually use and trust
What Is BI Software and Why Does It Matter in 2026?
Business intelligence software is technology that retrieves, processes, analyzes, and presents data to help organizations make informed decisions. Unlike traditional static reporting that delivers the same charts weekly, modern BI has split into two camps: self-service visualization platforms where users build their own dashboards, and AI-driven platforms where users simply ask questions and receive complete analyses.
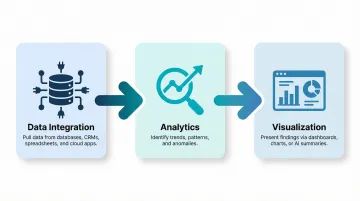
All BI tools share three core functions:
- Data integration — Pulling information from databases, spreadsheets, CRM systems, and cloud applications into one environment
- Analytics — Identifying trends, patterns, and anomalies that signal opportunities or risks
- Visualization — Presenting findings through dashboards, charts, or natural language summaries
The 2026 landscape shift centers on AI-first analytics. Forrester dropped the "augmented" prefix from BI coverage because AI is now baseline functionality, not a premium add-on — and 78% of companies leveraged AI within their BI systems in 2025. The defining trend shaping tool selection this year: users no longer need SQL or drag-and-drop skills to get answers. They ask questions in plain English and receive complete, verified analyses grounded in their actual data.
That shift is overdue.
This matters because traditional per-seat licensing has left 80% of business users without hands-on BI access. AI-native platforms are breaking that ceiling by making analytics accessible to everyone, not just data specialists.
Best BI Software: Top Business Intelligence Tools in 2026
These tools were evaluated on AI and analytics capabilities, ease of use for both technical and non-technical users, data governance, integration ecosystem, deployment flexibility, and pricing transparency.
Sylus
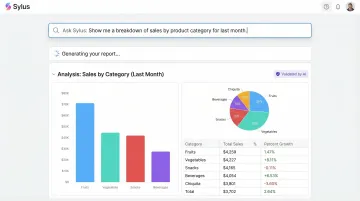
Sylus is an AI-powered analytics platform built for data teams who need governed, scalable analytics. It connects to your data sources and lets anyone ask questions in plain English, generating complete dashboards and validated analyses grounded in your dbt models and dbt documentation.
What makes Sylus stand out: It functions as an AI data analyst that thoroughly explores data and validates assumptions before returning results—not just a chatbot that guesses at answers. The platform is built on governed context (not raw LLM inference), supports unlimited seats with usage-based pricing, offers self-hosted deployment, and is SOC 2 Type II and HIPAA compliant. This makes it suitable for both fast-growing startups and regulated enterprises that need to give all business users access to analytics without loosening governance controls.
Notable customers include OpenAI—a signal of the platform's ability to handle demanding, high-stakes analytics environments.
| Category | Details |
|---|---|
| Key Features | AI data analyst grounded in dbt models; plain English querying; auto-generated dashboards; Slack integration; scheduled reports and AI summaries; alerts for data spikes; self-hosted deployment option; 500+ data source integrations |
| Best For | Data teams and business users at startups and enterprises who want governed, AI-powered analytics without per-seat licensing constraints |
| Pricing | Usage-based pricing with unlimited seats; self-hosted option available; SOC 2 Type II and HIPAA compliant |
Microsoft Power BI
Microsoft Power BI is the market heavyweight, with over 30 million monthly active users and 97% Fortune 500 penetration. Named a Leader in the 2025 Gartner Magic Quadrant for Analytics and BI Platforms for the 18th consecutive year, it integrates natively with the Microsoft ecosystem (Excel, Azure, Teams) and supports over 150 pre-built data connectors.
Differentiators: Strong enterprise adoption, AI-powered features via AutoML and Azure Cognitive Services (on Premium tier), row-level security and data governance controls, and broad self-service reporting tools. Best suited to organizations already invested in the Microsoft stack, where integration overhead is minimal and licensing bundles with Microsoft 365 E5.
| Category | Details |
|---|---|
| Key Features | Interactive dashboards; DAX and Power Query support; AI-powered modeling (Premium); 150+ connectors; row-level security; Microsoft ecosystem integration |
| Best For | Organizations in the Microsoft ecosystem needing scalable self-service reporting |
| Pricing | Power BI Desktop: Free; Pro: $14/user/month; Premium Per User: $24/user/month; Fabric Capacity: Variable pay-as-you-go |
Tableau
Tableau (now part of Salesforce) is one of the most established data visualization platforms, known for its intuitive drag-and-drop interface and support for over 100 native data source connectors. Named a Leader in the 2024 Gartner Magic Quadrant for the 12th consecutive year, it's used by over 120,000 organizations globally.
Differentiators: Deep visual analytics capabilities, Salesforce Einstein integration for AI-assisted insights, a large community and ecosystem of extensions, and strong performance for complex visual storytelling. Higher per-user pricing and dedicated admin resources are often required to maintain deployments at scale.
| Category | Details |
|---|---|
| Key Features | Drag-and-drop visual analytics; 100+ native connectors; predictive analytics; Salesforce Einstein integration; collaboration and sharing; desktop, server, and cloud deployment |
| Best For | Analytics teams that prioritize rich data visualization and have Salesforce ecosystem dependencies |
| Pricing | Standard: Creator $75/user/month, Explorer $42/user/month, Viewer $15/user/month; Enterprise: Creator $115/user/month, Explorer $70/user/month, Viewer $35/user/month |
Qlik Sense
Qlik Sense is built around a proprietary Associative Analytics Engine that explores relationships across all data—not just filtered subsets—enabling users to discover unexpected connections. Named a Leader in the 2025 Gartner Magic Quadrant for the 15th consecutive year, Qlik differentiates itself through its technical architecture.
Differentiators: The Associative Engine uses compressed binary indexing and logical inference to retain all data from all sources, exposing both associated and unassociated values. This reveals hidden risks and opportunities that traditional SQL-based tools filter out. The platform also offers AI-driven insights, natural language search, and flexible cloud and multi-cloud deployment—well-suited for exploratory analysis across complex, interconnected datasets.
| Category | Details |
|---|---|
| Key Features | Associative Analytics Engine; natural language interaction; AI-suggested insights; self-service data discovery; mobile and embedded analytics; on-premises and cloud deployment |
| Best For | Organizations that need exploratory analytics across complex, interconnected datasets |
| Pricing | Starter: $300/month (10 users, 10 GB); Standard: $825/month (25 GB); Premium: $2,750/month (50 GB); Enterprise: Custom pricing |
Looker (Google Cloud)
Looker is Google Cloud's enterprise BI platform, distinguished by its LookML semantic modeling layer that allows data teams to define business metrics centrally. Named a Leader in both the 2024 and 2025 Gartner Magic Quadrants, Looker ensures all downstream queries and dashboards use consistent definitions.
Differentiators: Strong data governance through centralized metric definitions, deep integration with Google BigQuery and the broader Google Cloud ecosystem, embedded analytics capabilities, and API-first architecture. Setup requires SQL and LookML knowledge, making it better suited for data-team-led deployments than fully self-service use.
| Category | Details |
|---|---|
| Key Features | LookML semantic layer; Google BigQuery native integration; embedded analytics; API-first architecture; governed metric definitions; Git-version-controlled data models |
| Best For | Data engineering teams building governed, scalable analytics infrastructure on Google Cloud |
| Pricing | Pricing available on request through Google Cloud sales |
Domo
Domo is a cloud-native BI platform that integrates data from spreadsheets, databases, and cloud applications into a single environment. Positioned as a Challenger in the 2024 Gartner Magic Quadrant, it provides both executive-level dashboards and granular analytics with AI-powered insights.
Differentiators: Over 1,000 pre-built connectors, AI-powered data transformation and insights, flexible deployment (Domo cloud or customer's own cloud), and low- and no-code tools that allow non-technical users to participate. The platform uses consumption-based (credit-based) pricing rather than per-seat licensing, which removes access paywalls for broader teams. Note that the learning curve is steep and costs can climb significantly at scale.
| Category | Details |
|---|---|
| Key Features | 1,000+ data connectors; AI-powered insights; no-code and low-code tools; flexible cloud deployment; mobile analytics; automated decision-making workflows |
| Best For | Organizations that need broad data integration across many cloud sources with accessible self-service analytics |
| Pricing | Consumption-based (credit-based) pricing; specific tiers available on request |
How We Chose the Best BI Tools for 2026
We assessed tools across six dimensions: AI and natural language analytics capabilities, ease of use for non-technical users, data governance and security compliance, depth of integration with common data sources and warehouses, deployment flexibility (cloud, on-premises, self-hosted), and pricing model transparency (per-seat vs. usage-based).
Common mistakes organizations make when selecting BI tools:
- Over-indexing on dashboard aesthetics instead of workflow fit
- Choosing based on brand recognition rather than team maturity
- Underestimating governance requirements in regulated industries
- Ignoring per-seat licensing costs that balloon as organizations scale
The most important emerging differentiator in 2026 is how deeply AI is embedded in the analytics workflow — not just as a chart suggestion feature, but as a capability that can validate assumptions, explore data autonomously, and return a trusted final deliverable. A Forrester Total Economic Impact study found that organizations deploying AI-powered BI platforms achieved 321% ROI over three years, with payback periods under six months.
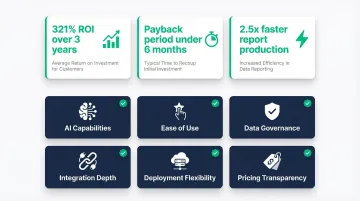
That ROI is measurable at the individual level too. AI-powered BI tools save users over 2 hours per week and make producing reports 2.5x faster.
Much of that ROI comes from eliminating bottlenecks. Traditional per-seat models create artificial scarcity — only a few team members get licenses, forcing everyone else to wait for analyst bandwidth. Usage-based and capacity-based models break this ceiling, enabling broader access without exponential cost increases.
Conclusion
The right BI tool in 2026 matches your team's data maturity, workflow, and scale. Traditional visualization platforms like Power BI and Tableau remain strong choices for established Microsoft and Salesforce shops with dedicated analytics teams. Platforms like Sylus take a different approach — grounding every query in your governed dbt models so business users get accurate, context-aware answers without bypassing your data team's definitions.
When evaluating tools, look beyond the feature list:
- Per-seat licensing costs — these compound fast at scale; Sylus uses usage-based pricing with unlimited seats
- Governance capabilities — can the platform enforce your data definitions, or does it let users freewheel?
- Analyst dependency — will this tool reduce bottlenecks on your data team, or create new ones?
Sylus is built for teams that need answers fast without sacrificing accuracy. It connects directly to your data sources, grounds analysis in your dbt models and documentation, and lets anyone on your team query data in plain English — with results delivered as shareable dashboards or scheduled reports to Slack and email. It's SOC 2 Type II and HIPAA compliant, with self-hosted deployment available for teams with strict data residency requirements.
Frequently Asked Questions
What is a business intelligence solution?
A BI solution is a combination of tools, technologies, and processes that turn raw business data into actionable insights through data integration, analytics, and visualization. It enables teams to make faster, more informed decisions by surfacing trends, anomalies, and opportunities hidden in operational data.
What does BI stand for?
BI stands for Business Intelligence—the strategies, technologies, and software used to collect, analyze, and present business data for organizational decision-making.
What is BI used for?
BI is used for tracking KPIs, identifying trends and anomalies, forecasting outcomes, and generating reports and dashboards. It also enables self-service data exploration, so business teams can answer their own questions without routing every request through an analyst.
What is the best AI tool for business intelligence?
AI-native BI platforms like Sylus—which let users ask questions in plain English and receive governed, validated analyses—represent the leading edge of AI in BI. Traditional platforms like Power BI and Tableau also offer AI features, but as add-ons rather than core functionality.
How is AI used in business analytics?
AI is applied in BI to automate data preparation, surface anomalies proactively, enable natural language querying, and generate predictive forecasts. AI-authored summaries and reports reduce reliance on analysts for routine analysis, giving every team direct access to insights.
What are the top 5 BI tools?
The top BI tools covered in this article are Sylus, Microsoft Power BI, Tableau, Qlik Sense, and Looker. The best choice depends on your team size, technical maturity, and whether governed, conversational analytics is a core requirement.