Introduction
Most customer churn is invisible until it's too late. By the time a cancellation request lands in your inbox, the warning signs were present weeks or months earlier—buried in declining login frequency, abandoned features, or radio silence after a support ticket. According to research, 70-80% of churned customers show identifiable risk signals 30+ days before cancellation, yet most companies only discover these patterns in monthly reports, when the intervention window has already closed.
The gap between companies that retain customers and those that lose them comes down to timing. Traditional batch analytics, where insights arrive hours or days after the events that matter, leave teams reacting to churn rather than preventing it.
Real-time insights flip this dynamic by surfacing what's happening now, enabling proactive intervention while customers are still reachable.
This post covers five practical ways to use live customer data for retention. Each is tied to a concrete action your team can take using real-time behavioral signals—from catching churn before it happens to empowering customer success teams with instant alerts.
Key Takeaways
- Real-time monitoring catches behavioral churn signals—declining usage, feature abandonment, login gaps—before cancellation happens
- Live data enables behavior-triggered outreach that's timely and relevant, not calendar-based blasts
- Friction points caught early can be fixed while customers are still engaged—not after they've churned
- Instant alerts give CS teams the context to have proactive conversations, not reactive damage control
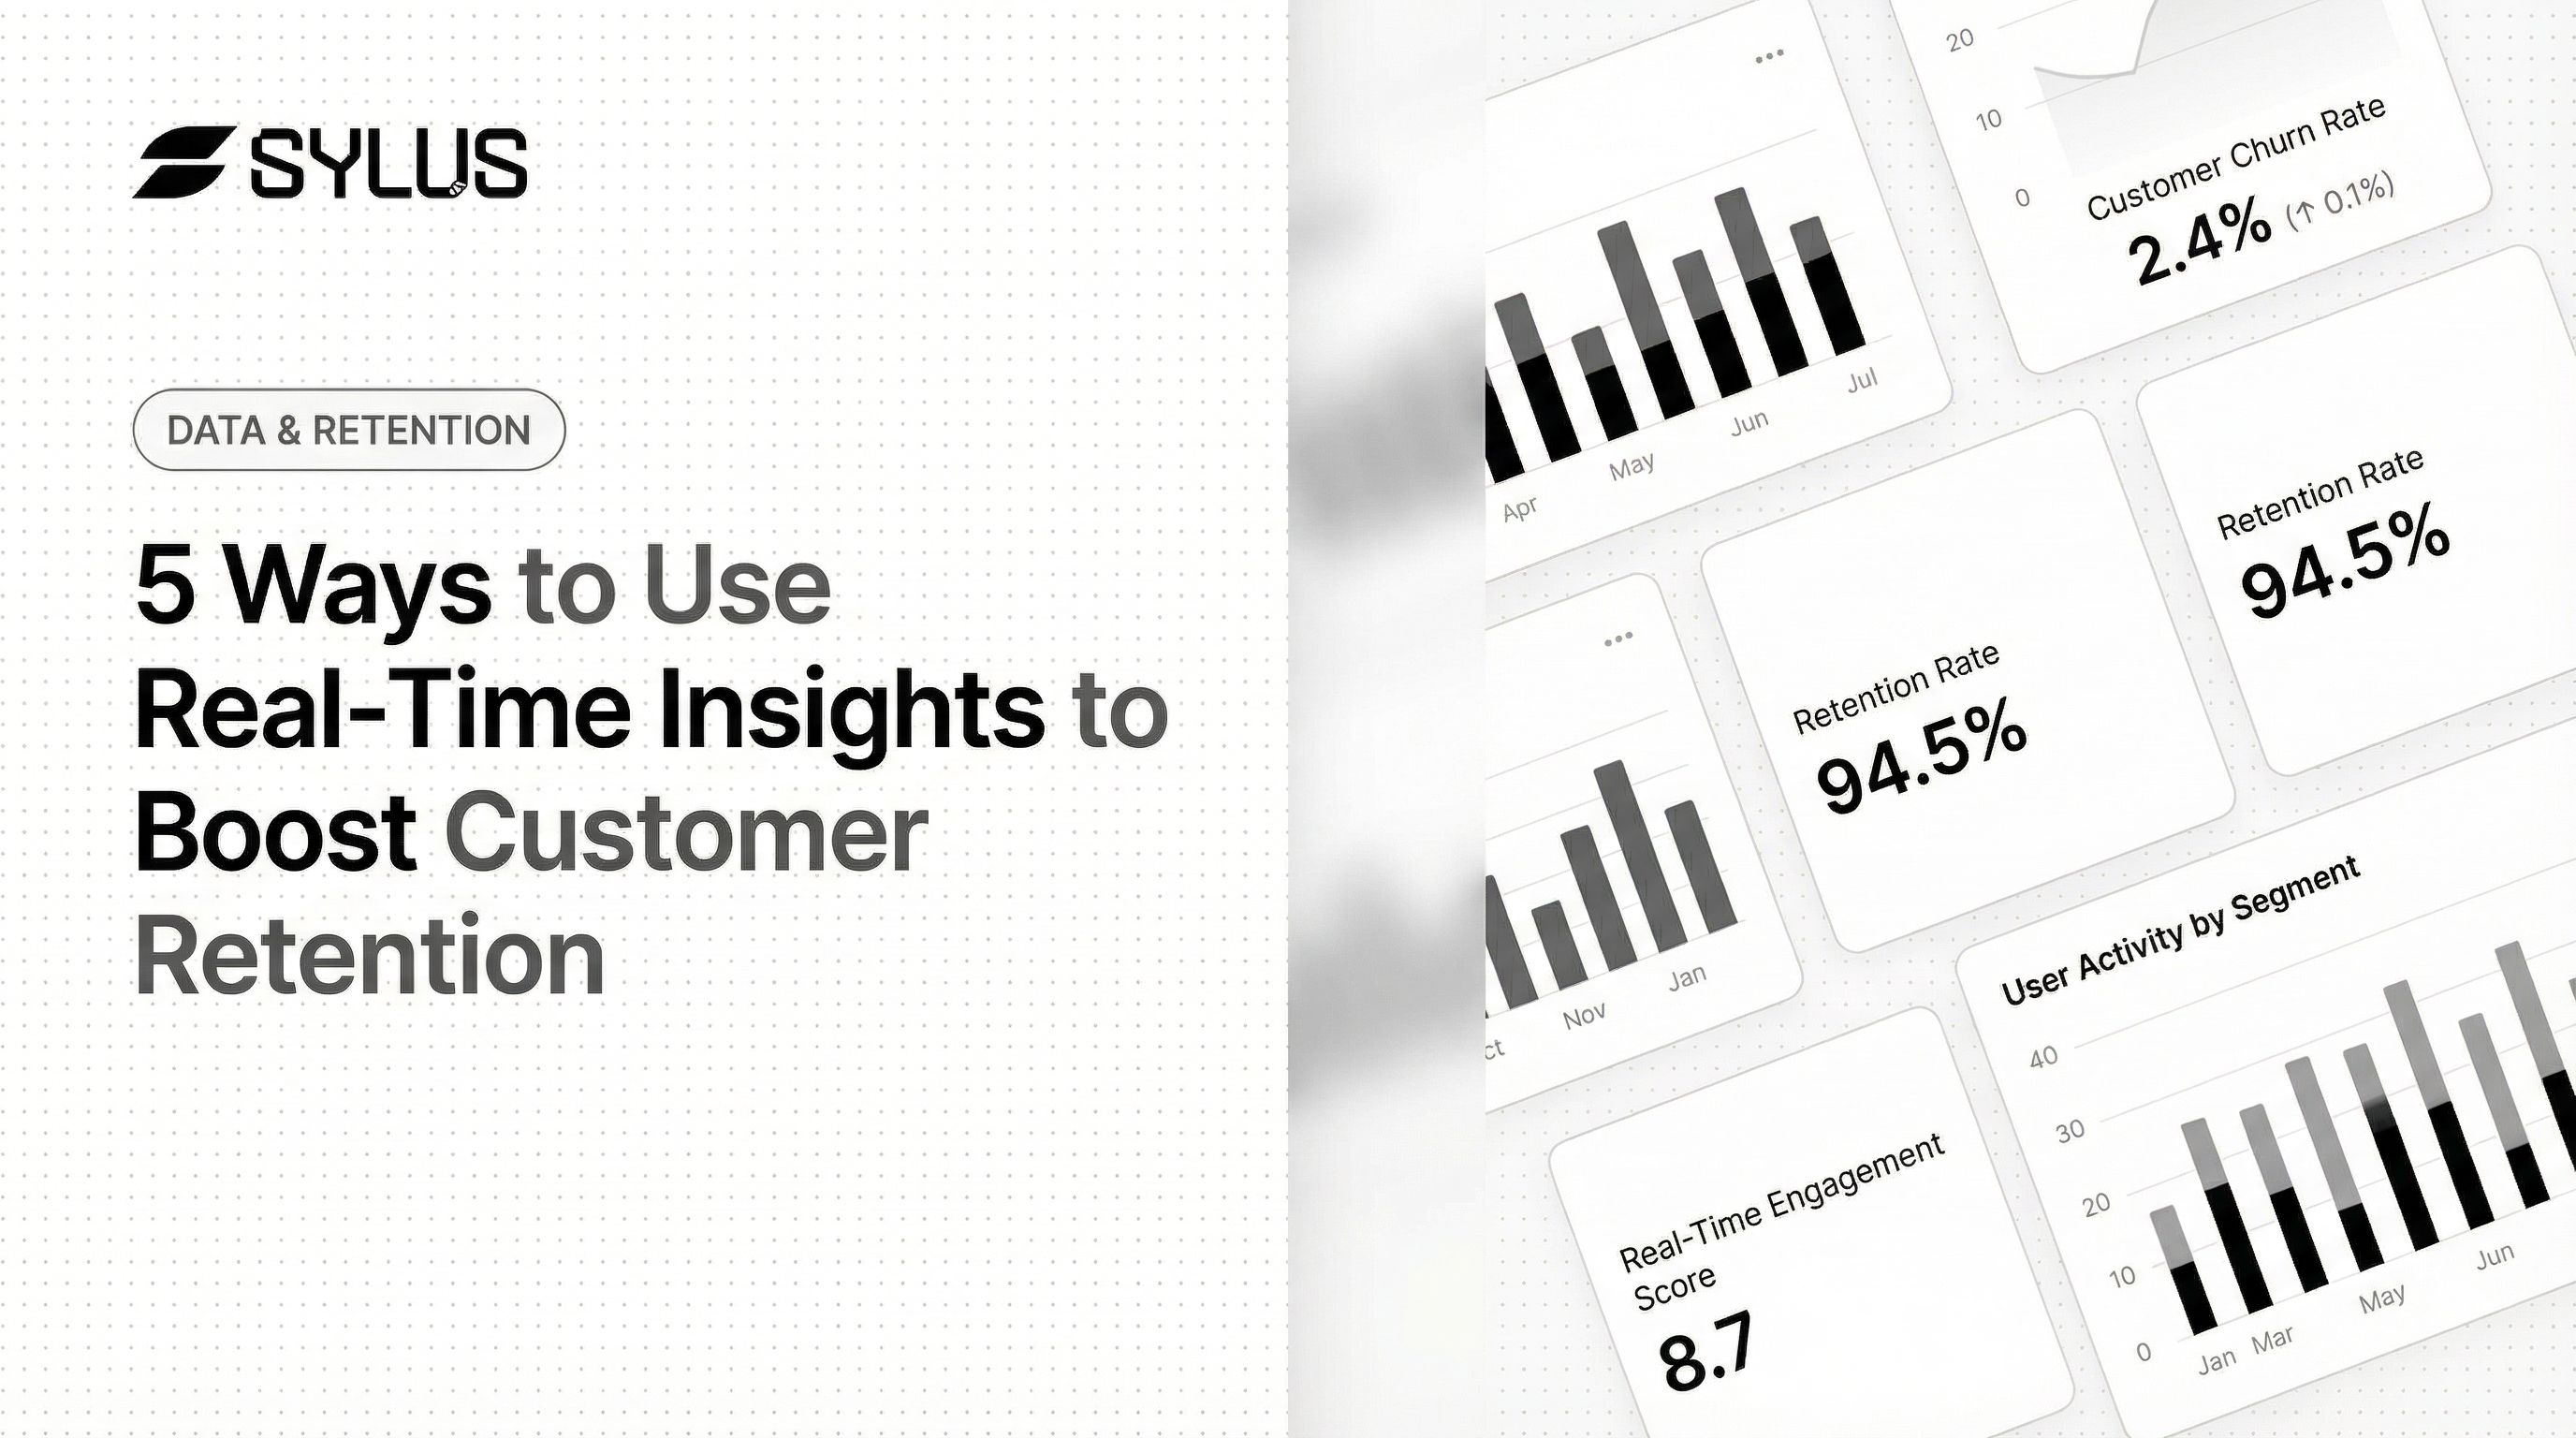
- Real-time retention dashboards replace lagging reports with live KPIs that reflect current customer health
What Are Real-Time Customer Insights?
Real-time customer insights represent the continuous collection and analysis of behavioral, transactional, and engagement data as it is generated—not hours, days, or weeks later. IBM defines real-time analytics as "the process of analyzing data as it becomes available," applying logic to information streams to support faster, better decisions.
This contrasts sharply with traditional batch processing, where data is collected over time and analyzed in scheduled intervals—overnight runs, weekly exports, or monthly business reviews. The difference in latency is critical: streaming processing handles requirements from hours down to seconds and milliseconds, while batch processing is limited to hours or minutes at best.
For retention teams, real-time means near-instantaneous streams from the signals most predictive of whether a customer will stay or leave:
- Product usage events
- Support interactions
- NPS responses
- Billing activity
- Session behavior
IDC research shows that 13% of enterprise use cases require decisions in seconds, and 63% must process data within minutes to be useful. When customer success teams rely on weekly or monthly reports, the intervention window has often already closed.
Way 1: Spot Churn Signals Before Customers Leave
Churn is rarely a sudden event. It's the lagging outcome of a gradual behavioral decline that unfolds over weeks or months. The problem: these patterns only surface if you're watching continuously. A monthly usage report is almost always too late.
The Early Warning Window
Research shows that voluntary churn accelerates 90 days before cancellation, with product usage declining by an average of 41% in the quarter preceding cancellation. Even more telling, login frequency decline provides the earliest signal at 60 days before churn. That 60-day window is where real-time monitoring earns its value.
Real-time behavioral monitoring streams event-level data from your product into an analytics layer, where thresholds or anomaly detection models flag accounts that deviate from their own usage baseline. A customer who logged in daily for three months and has now gone silent for seven days triggers an alert. Not because seven days is objectively bad — but because it's a sharp drop from that account's established pattern.
Which Signals Matter Most
Not all behavioral changes predict churn equally. Combining multiple signals improves prediction accuracy:
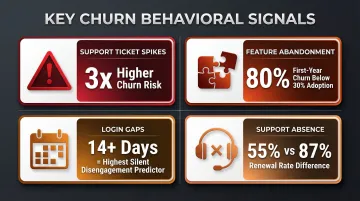
- Support ticket spikes – Customers submitting multiple support requests show a 3x higher churn risk
- Feature abandonment – Feature adoption below 30% correlates with an 80% first-year churn rate
- Login gaps – No login for 14+ days from a previously active user is the highest silent disengagement predictor
- Support interaction absence – 87% of customers who never contacted support renewed, while only 55% who made one support contact renewed (a 32-point difference)
Prioritizing Intervention
The most effective systems combine behavioral signals with account health attributes to score churn risk and route high-risk accounts to the right team members immediately:
- Contract size — higher-value accounts escalate to senior CSMs
- Renewal date proximity — accounts within 60 days of renewal get priority queuing
- Support ticket volume — recent spike activity triggers immediate outreach
This scoring prevents alert fatigue by surfacing only the accounts that need attention now.
Platforms like Sylus enable teams to set up alerts when there are spikes or drops in key activity metrics, notifying customer success and account management teams in real time without requiring manual queries or weekly report generation. The result: your team learns about disengagement when there's still time to act on it — not after the cancellation email arrives.
Way 2: Personalize Outreach at the Moment It Matters
Effective retention personalization means reaching customers with the right message when it's actually relevant to what they're doing — not just addressing them by name. Real-time data makes this possible by triggering outreach from live behavioral signals rather than scheduled campaigns.
Behavior-Triggered Campaigns vs. Batch-and-Blast
Consider these scenarios:
- A customer completes onboarding but hasn't activated a key feature within 48 hours → receives an in-app nudge with a tutorial
- A user visits the pricing or cancellation page → triggers an alert to their account manager for immediate follow-up
- A power user suddenly stops using a feature they relied on → gets a personalized check-in email asking if they encountered an issue
This differs from traditional segmentation-based outreach. Instead of sending a generic "we miss you" email to all users who haven't logged in for 30 days, real-time systems tailor the message based on which features the user valued, when their renewal is, and what support interactions they've had.
The Performance Difference
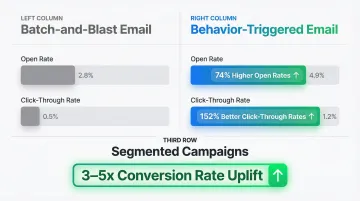
The data is compelling. Behavior-based email triggers achieve 74% higher open rates and 152% better click-through rates than traditional batch emails. Segmentation compounds this effect: properly segmented emails achieve 3-5x higher conversion rates than batch campaigns.
The Risk of Poorly Timed Outreach
Those gains disappear when outreach misfires. Harvard research shows that poorly targeted proactive outreach can increase churn by 67% when it annoys customers or surfaces product failures without offering a solution. If a customer is frustrated by a specific bug, sending a generic "Quarterly Check-in" email demonstrates a lack of awareness and accelerates their departure. Outreach must be directly tied to the behavioral signal that triggered it.
Way 3: Identify and Remove Friction in the Customer Journey
Friction—moments where customers struggle, get confused, or give up—is a silent driver of churn. Real-time journey analytics lets product and customer experience teams see where users are dropping off or getting stuck right now, rather than discovering a broken onboarding flow three weeks after it started costing customers.
The 90-Day Danger Zone
The first 30 to 90 days after a customer signs up are the most important in defining the lifetime of that account. Industry data shows that 15-25% of annual churn occurs in the first 90 days due to onboarding issues. And 66% of B2B buyers cite a poor onboarding experience as the reason they stopped purchasing from a vendor.
Real-Time Journey Monitoring in Practice
Real-time journey monitoring streams event data that gives teams immediate visibility across the full user path. Specifically, it:
- Maps session paths to show exactly where users navigate
- Tracks workflow abandonment at the step level
- Surfaces error rates and support ticket spikes tied to specific product areas
- Identifies which friction points correlate most with accounts that later churn
The value is speed-to-fix. A friction point caught in real time can be addressed with a support article, in-app tooltip, or proactive outreach within hours. The same issue surfaced in a monthly review may have already affected dozens of accounts by then.
Accelerating Time-to-First-Value
Reducing the time it takes for a customer to realize value is the strongest lever for early-stage retention:
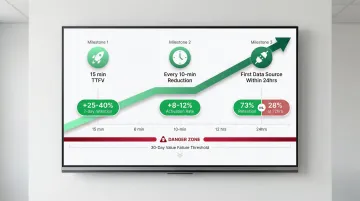
- Reducing time-to-first-value by 50% (e.g., 30 minutes to 15 minutes) increases 7-day retention by 25-40%
- Each 10-minute reduction in TTFV produces an 8-12% improvement in activation rate
- Customers who connect their first data source within 24 hours see 73% retention versus 28% retention for those who take 72 hours
Customers who do not achieve their desired outcome within 30 days are 3x more likely to churn. Every day a friction point goes unaddressed is another window for a customer to conclude the product isn't working for them.
Way 4: Empower Customer Success Teams with Live Alerts
Customer success teams are most effective when they operate from current information. But in most companies they're still working from CRM notes, last quarter's QBR data, and weekly health score exports. Real-time alerts change this by surfacing the moments that matter as they happen, giving CS teams the context to have timely, relevant conversations.
The Types of Alerts That Drive Retention
Live alerts that directly improve retention outcomes include:
- A sudden spike in support tickets from a specific account
- An executive-level user going inactive
- A customer completing a high-value workflow that signals expansion readiness
- A negative NPS response submitted hours ago that hasn't been followed up on
The 24-to-48 Hour Service Recovery Window
When a customer submits a negative NPS score or a support escalation, the clock starts ticking. Companies that do not "close the loop" on feedback increase their churn by at least 2.1% annually. Conversely, closing the loop within 48 hours can lead to a 12% increase in retention. Top-tier organizations mandate that dedicated response teams contact detractors within 24 hours, addressing concerns before they escalate.
Routing Alerts to the Right Team Members
Routing alerts to the right team member reduces the time between a warning signal and a human response. Surfacing them in tools CS teams already use—like Slack or email—removes the friction of switching to a separate analytics dashboard. Platforms like Sylus can schedule AI-generated summaries and push alerts directly to those channels, keeping CS teams informed without adding to their workflow.
That speed-to-response translates directly into retention outcomes. By implementing real-time AI-driven conversation analysis, one company consolidated tickets and calls into a single view, resulting in a 30% improvement in month-over-month retention within just six weeks.
Way 5: Track Retention KPIs as They Move, Not After
Retention metrics like Monthly Recurring Revenue (MRR) churn rate, Net Revenue Retention (NRR), product adoption rate, and customer health scores are often only reviewed in monthly or quarterly business reviews. By the time those reviews happen, the trends that matter have already played out. Real-time dashboards shift retention KPI monitoring from a retrospective exercise to an active one.
What Effective Real-Time Retention Dashboards Track
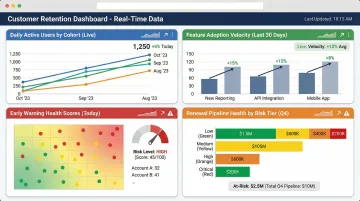
Real-time retention dashboards should monitor:
- Daily active users by cohort – Track engagement patterns as they develop, not weeks later
- Feature adoption velocity – See how quickly new customers activate core workflows
- Early warning health scores – Combine usage and support signals into composite risk indicators
- Renewal pipeline health – Segment by risk tier to prioritize intervention efforts
These dashboards should be accessible to both data teams and business users—not locked in a BI tool that only analysts can interpret.
The Shift to Real-Time Dashboards
Leading teams use near-real-time dashboards to explore microsegments and identify the granular drivers behind NRR movement. Forrester confirms a clear market shift: enterprises are moving away from fragmented architectures toward unified platforms that support AI-driven decisions at digital speed, eliminating silos and latency that degrade decision quality.
Democratizing Access to Retention Data
That shift toward unified platforms only pays off when business stakeholders can actually access the data—not just analysts. Generating, customizing, and sharing retention dashboards in plain English rather than SQL removes the bottleneck between data teams and the people responsible for acting on what they find. Platforms like Sylus allow users to ask data questions in plain English and generate shareable dashboards instantly, reducing time-to-insight for the teams responsible for retention.
For example, a CS manager can query "show me accounts with declining usage in the last 30 days" and receive an instant visualization with drill-down capabilities—without waiting for a data analyst to build a custom report.
Frequently Asked Questions
What are real-time insights?
Real-time insights are conclusions drawn from data as it is generated—rather than from historical batch reports—enabling teams to respond to customer behavior while there is still time to act.
What kind of insights does real-time provide?
Real-time systems surface behavioral signals (product usage, session activity), transactional patterns (purchases, renewals, cancellations), support interactions, and engagement metrics—including login frequency, feature adoption, support ticket volume, and NPS responses—as events occur rather than in scheduled reports.
What is an example of a real-time analysis?
Detecting that a customer's weekly active usage has dropped 60% below their personal baseline, triggering an automated alert to their account manager within minutes of the threshold being crossed.
How do real-time insights improve customer retention?
Real-time insights improve retention by shortening the window between a warning signal (behavioral drop-off, negative feedback, friction) and a human or automated response—intervening before churn becomes a decision, not just a risk.
How is real-time analytics different from traditional analytics for retention?
Traditional analytics surfaces retention trends after the fact (e.g., monthly churn reports showing what happened last quarter), while real-time analytics surfaces the individual signals that predict churn while there is still time to act on them—login gaps, feature abandonment, support escalations.
What data sources feed real-time customer insights?
Common sources include product usage event streams, CRM and support ticket systems, billing and subscription data, NPS survey responses, and marketing engagement data—connected so teams can query all of it in one place. Sylus supports 500+ integrations across these categories.