Introduction: The New Era of Business Intelligence
Traditional business intelligence tools trap insights behind technical barriers. Data teams spend days building queries, creating reports, and maintaining dashboards—while business users wait. By the time insights arrive, market conditions have already shifted. This analyst bottleneck isn't just frustrating; it's expensive. Research shows that data professionals waste 60% to 80% of their time on data preparation rather than generating insights.
AI-powered BI compresses this cycle from days to seconds. As of 2025, 88% of organizations report using AI in at least one business function, with over 50% of data and analytics leaders deploying AI tools for automated insights and natural language queries. Business users can now ask questions in plain English and receive validated answers instantly—no SQL required, no analyst queue.
This guide covers how traditional BI is evolving into AI-powered intelligence—the technologies driving the shift, core capabilities being reimagined, real-world applications, implementation challenges, and how to evaluate tools that deliver on data democratization.
TLDR
- AI-powered BI eliminates analyst bottlenecks by enabling business users to query data in plain English and receive instant insights
- ML, NLP, and retrieval-augmented generation automate analysis, reduce errors by 20-50%, and ground outputs in governed data models
- Conversational analytics, automated dashboards, predictive forecasting, and proactive anomaly detection are replacing static reports and manual workflows
- Security, data quality, and change management remain critical—organizations must verify SOC 2 compliance, ensure clean data, and build user trust
- Key evaluation criteria: natural language accuracy, governed context grounding, unlimited user seats, and transparent metric verification
Traditional BI vs. AI-Powered BI: What's Actually Changing
Traditional BI operates on a rigid, analyst-dependent model. Business users submit ticket requests to data teams, who manually build SQL queries, construct dashboards, and generate reports. This process takes days or weeks, creating a "last mile" problem where insights arrive too late to influence decisions.
That gap between data and changed behavior is where most BI initiatives fail. Data sits in warehouses but never reaches decision-makers in time or in a usable format.
Static dashboards compound the problem. Once built, they answer only the questions they were designed for. When business conditions shift or new questions emerge, users return to the ticket queue. Only 37% of executives report their organizations make both high-quality and high-velocity decisions, revealing how traditional BI fails to keep pace with business needs.
AI-powered BI rewrites this workflow. Business users ask questions in plain English—"What were our top 5 revenue drivers last quarter?"—and the AI interprets intent, queries underlying data, validates metric definitions, and returns a finished analysis within seconds. The technical intermediary disappears for routine data questions, freeing analysts to focus on complex strategic work.
The practical result: marketers, sales leads, and operations managers access their own data without waiting for overloaded data teams. The contrast with traditional BI is sharp:
- Traditional BI: Ticket submitted → analyst builds query → dashboard delivered in days
- AI-powered BI: Question asked in plain English → validated analysis returned in seconds
- Governance maintained: Metric definitions and data context stay consistent across both models

By 2027, Gartner predicts 50% of business decisions will be augmented or automated by AI agents for decision intelligence. Organizations that close the gap between data and decision-making earliest will have a meaningful advantage — not just in speed, but in the quality of questions their teams think to ask.
The AI Technologies Powering Modern Business Intelligence
Machine Learning: Pattern Recognition at Scale
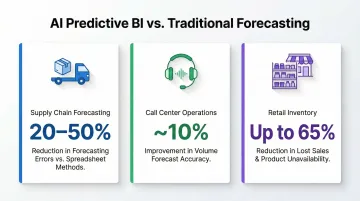
Machine learning algorithms identify patterns across historical datasets that humans would never spot manually. ML models continuously improve as more data flows in, enabling use cases like demand forecasting, churn prediction, and automated anomaly detection. AI-driven operations forecasting reduces errors by 20% to 50% compared to traditional spreadsheet-based methods, translating into up to 65% reduction in lost sales and product unavailability.
ML shifts BI from reactive to proactive. Instead of waiting for quarterly reviews to spot trends, models surface insights automatically—flagging which customer segments show early churn signals, which products are trending upward, or which operational metrics are deviating from expected ranges.
Natural Language Processing: Eliminating the SQL Barrier
NLP allows users to type or speak questions in plain English and receive coherent answers without writing code. Gartner defines Natural Language Query (NLQ) as a capability that "enables users to ask questions of the data using terms that are either typed into a search box or spoken aloud." Modern NLP translates conversational inputs into complex analytical queries, democratizing data access for non-technical users.
The technology has matured rapidly. Major vendors like Microsoft and Tableau have deprecated legacy keyword-based NLQ tools in favor of generative AI copilots, requiring organizations to migrate to governed semantic layers to ensure accuracy. Over 50% of data and analytics leaders now report their organizations use AI tools for natural language queries, making NLQ a standard expectation rather than a premium feature.
Generative AI: From Charts to Narratives
Generative AI automates the creation of data narratives, written summaries of trends, and full dashboards. It moves BI from raw charts to finished, shareable deliverables that explain the "so what" behind the numbers. When a sales leader asks about quarterly performance, gen AI doesn't just return a chart—it generates a dashboard with relevant metrics, appropriate visualizations, and narrative insights explaining what drove changes.
This capability cuts time-to-insight considerably. Creating dashboards that once took days now takes minutes. Gen AI selects relevant metrics, chooses appropriate chart types, and even generates written summaries that non-technical stakeholders can immediately understand and act on.
Governed Context: The Foundation of Trust
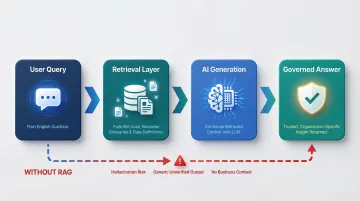
Generic large language models hallucinate, producing plausible-looking but incorrect answers. For enterprise BI, that's an unacceptable risk. The solution is governed context: grounding AI in company-specific data models, documented metrics, and verified business logic.
The dbt semantic layer serves as this governance foundation. It acts as a translation layer between raw data and analytics tools, defining metrics once in clear business terms. When AI tools access this layer via APIs, they retrieve current, approved metric definitions rather than guessing calculation logic. This ensures AI outputs are trustworthy and aligned with how the business actually defines success.
Sylus exemplifies this approach: the platform grounds all analysis in dbt models and documentation, ensuring every insight respects established data governance standards. This governed context prevents the metric inconsistencies that plague organizations when different teams define "revenue" or "active user" differently.
Retrieval-Augmented Generation: Tying It Together
RAG is the architectural pattern that enables AI to ground responses in enterprise truth. Instead of relying solely on training data, RAG retrieves relevant external documents at inference time—pulling from your specific data sources, dbt documentation, and business glossaries. Academic research confirms RAG significantly reduces hallucinations in structured outputs and improves generalization in enterprise settings.
RAG ensures AI answers reflect your organization's actual data, definitions, and business rules. When a user asks about customer churn, the system retrieves your organization's churn definition, historical churn data, and documented business rules before generating an answer. This retrieval step is what separates trustworthy enterprise BI from generic chatbots.
How AI Is Transforming Core BI Capabilities
Conversational Analytics and Natural Language Querying
Conversational analytics replaces the "submit a ticket to the data team" workflow entirely. Users ask a question, the AI maps it to the right tables and metrics, runs the query, and returns a chart or table—often in seconds. That puts data access in the hands of anyone who can type a question, not just analysts.
Accuracy requirement: AI must confirm metric definitions before returning results, not just produce a plausible-looking number. When a user asks "How did we do last quarter?" without specifying a metric, the system should clarify intent or default to the organization's standard performance metrics—grounded in dbt documentation—rather than guessing.
Platforms like Sylus demonstrate this in practice. Users query data directly from Slack using simple commands like "@sylus show me my top customers," receiving instant bar charts with validated metrics. The system offers to clarify how results were obtained, enabling transparent, trustworthy analytics without leaving the workflow.
Automated Dashboard and Report Generation
AI now generates entire dashboards from simple prompts—selecting relevant metrics, appropriate chart types, and layouts—cutting time from "we need a dashboard" to "here it is" from days to minutes. The AI reasons through data structure, identifies key performance indicators, and presents them in cohesive, modern formats.
Users can customize dashboards post-generation using plain English. Requests like "make this chart Christmas-themed" or "show revenue by brand as a pie chart instead" modify visualizations without rebuilding from scratch. The result: rapid iteration without touching underlying data logic.
Scheduled delivery takes automation further. Teams configure AI-generated summaries and reports to deliver automatically to email or Slack channels. Stakeholders stay informed without manual report creation each cycle, and alerts notify teams when unusual activity spikes occur—enabling proactive response rather than reactive discovery.
Predictive Analytics: From Describing the Past to Forecasting the Future
Traditional BI describes what happened. Predictive BI forecasts what will happen. AI models trained on historical data forecast sales trends, customer churn risk, and inventory needs with significantly higher accuracy than manual forecasting.
The gains show up across industries:
- Supply chain forecasting: 20-50% reduction in forecasting errors vs. traditional spreadsheet methods
- Call center operations: ~10% improvement in volume forecast accuracy
- Retail inventory: Up to 65% reduction in lost sales and product unavailability
These gains directly reduce operational costs, prevent stockouts, and improve resource allocation. Organizations shift from reacting to past performance to proactively preparing for future conditions.
Anomaly Detection and Proactive Alerting
AI continuously monitors data streams and surfaces unusual spikes, drops, or patterns automatically—rather than waiting for a human analyst to notice something is off in a weekly review. Teams catch problems and opportunities as they emerge, not days later.
The business impact is substantial. Research shows AI-powered anomaly detection helps organizations avoid more than $1.5 million in lost revenue due to data downtime, reclaim over 6,500 data personnel hours annually, and resolve data quality issues 80-90% faster. Automated alerts protect millions in revenue that would otherwise be lost to flawed decision-making based on corrupted or incomplete data.
Real-World Applications Across Business Functions
Sales and Marketing: Forecasting and Campaign ROI
Sales and marketing teams use AI BI to analyze pipeline performance, campaign ROI, and customer segment behavior. AI surfaces which channels, products, or segments are over- or underperforming without requiring manual deep dives.
Salesforce upgraded its internal sales analytics by deploying Tableau Pulse, giving account executives AI-powered what-if scenarios to generate, validate, and adjust forecasts in real time. Results included:
- Real-time pipeline alerts (deal velocity, quota attainment) delivered directly into Slack
- 85% of the sales team redirected from administrative tasks back to selling
Platforms like Sylus enable similar capabilities through Slack integration. Sales leaders ask "show me my top customers" and receive instant visualizations showing customer performance based on Average Order Value, with the ability to drill down into specific accounts or time periods conversationally.
Finance and Operations: Cost Analysis and Budget Tracking
For finance teams, the main friction in traditional BI isn't access to data — it's the lag between when conditions change and when reports reflect it. AI BI closes that gap by flagging budget deviations and generating narrative variance explanations automatically, enabling faster corrective action.
Avolta, a global travel retailer operating across 70 countries, centralized its financial planning using Anaplan's AI-driven scenario planning. The company achieved a 50% reduction in the time required for its annual budget cycle, implementing their first budget in just three months instead of six. Real-time visibility into plan assumptions allowed the finance team to respond to changing market conditions rather than working from outdated forecasts.

Product and Data: Usage Metrics and Feature Adoption
Product and data teams have always tracked usage metrics, retention, and feature adoption — but traditional sprint-cycle reporting creates a two-to-four week lag before insights reach roadmap decisions. AI BI compresses that cycle significantly.
Pictory, an AI video creation platform, used Amplitude Analytics to segment users by behavior, industry, and job title to identify their ideal customer profile. By tracking key product indicators and using that data to guide feature decisions, Pictory achieved measurable results within three months:
- Churn rate dropped from 30% to 15%
- Conversions increased by 16%
- Cost of goods sold fell by 30%
The company focused on high-value segments — and the data made clear exactly which segments those were.
Challenges and Considerations When Adopting AI in BI
Data Quality: Garbage In, Garbage Out—Amplified
AI BI tools are only as reliable as the underlying data. Poorly governed data, inconsistent metric definitions, and missing documentation produce misleading AI outputs. The problem is expensive: Gartner research estimates poor data quality costs organizations an average of $12.9 million annually. Over a quarter of organizations estimate losses exceeding $5 million annually, with 7% reporting losses of $25 million or more.
AI amplifies these issues. When models train on flawed data, they reinforce errors at scale — across every report, dashboard, and automated insight your team relies on. Data readiness is a hard prerequisite. Before deploying AI BI tools, organizations need:
- Clean, well-modeled data with consistent definitions
- Documented metrics agreed upon across teams
- Active data governance policies, not one-time audits
Security and Compliance: Protecting Sensitive Business Data
When AI tools query sensitive business data, organizations must verify vendor security practices. Two certifications set the baseline:
- SOC 2 Type II — evaluates internal controls over a defined period (3-12 months) across Security, Availability, Processing Integrity, Confidentiality, and Privacy. Unlike a point-in-time audit, it proves controls work consistently over time.
- HIPAA — required when processing individually identifiable health information. Any Cloud Service Provider storing or processing ePHI legally becomes a "business associate" and must sign a Business Associate Agreement, even if they only hold encrypted data.
Organizations must also confirm that vendors don't use customer data to train AI models. Sylus explicitly commits that neither Sylus nor its model partners train on customer data, and offers self-hosted deployment in air-gapped environments for organizations with strict data residency requirements.
Change Management: Building Trust and Adoption
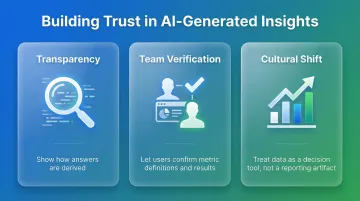
Even the best AI BI tool fails if adoption is low. Gartner predicts 80% of data and analytics governance initiatives will fail by 2027 — largely due to insufficient urgency and buy-in. Building trust in AI-generated insights requires three things:
- Transparency about how answers are derived
- Team collaboration features that let users verify metrics
- A cultural shift toward treating data as a decision-making tool, not a reporting artifact
Deloitte research notes that despite expanding access to workplace AI, employee usage is slipping—highlighting that AI value realization is a human trust problem, not just a technological one. Organizations must invest in training, demonstrate value through pilot projects, and establish clear governance frameworks that explain how AI reaches conclusions.
How to Evaluate and Choose an AI BI Tool
Core Evaluation Criteria
When evaluating AI BI platforms, assess these critical dimensions:
Natural language accuracy and query depth — Can the tool handle complex, multi-part questions? Does it clarify ambiguous queries or make assumptions?
Data source connectivity — Does it connect to your existing data warehouses (Snowflake, BigQuery, Redshift, Databricks) and integrate with your dbt models?
Governance and context grounding — Does the tool ground analysis in your documented metrics and business logic, or does it operate as a generic LLM that may hallucinate?
Security certifications — Does the vendor hold SOC 2 Type II and HIPAA compliance? Do they offer self-hosted deployment for sensitive environments?
Pricing model — Does pricing support broad adoption? Unlimited seat models like Sylus's usage-based pricing let more people access data without budget gates, while per-user pricing limits who can actually use the tool.
Trust and Verification Features
The best AI BI tools show their work, not just their answers. Look for platforms that let team members verify metric definitions, request clarification on how results were derived, and support collaborative review before insights are acted on.
Sylus builds this into the workflow directly. Users can request report verification, then track status through defined stages:
- Not Requested → Requested → In Review → Verified → Backlogged
Real-time comments and multiplayer collaboration keep the whole team accountable throughout the analytics process.
Start Small, Validate, Then Scale
Once you're confident a tool shows its work and handles your data correctly, resist the urge to roll it out company-wide on day one. Instead, identify one team with a clear data question, test accuracy against known answers, and expand from there. This focused approach reduces risk, builds organizational confidence, and surfaces integration challenges before they become enterprise-wide problems.
Successful pilots demonstrate tangible value quickly. Common early wins include:
- Sales teams identifying top customers without waiting on analyst reports
- Finance teams tracking budget variance in real-time
- Product teams monitoring feature adoption without analyst intervention
Once one team sees results, other teams tend to follow suit.
Frequently Asked Questions
What is the difference between traditional BI and AI-powered BI?
Traditional BI requires technical users to build static reports and queries manually, creating analyst bottlenecks and delayed insights. AI-powered BI allows any user to ask questions in plain English and receive instant, validated insights—eliminating dependency on data teams for routine questions and compressing time-to-insight from days to seconds.
How does natural language querying work in AI BI tools?
NLP technology interprets the user's plain-English question, maps it to relevant data tables and metric definitions (via a semantic layer like dbt), then returns a formatted answer or visualization. Users don't need to write SQL or understand database schemas—the AI handles the technical translation, grounding results in governed business logic.
Can non-technical business users actually use AI-powered BI tools?
Yes, and that's the core design goal. AI BI tools are built for marketing, sales, finance, and operations professionals who need data answers without routing every question through a data team. The best platforms combine natural language interfaces with governed context to ensure accessibility without sacrificing accuracy.
What are the biggest challenges of implementing AI in business intelligence?
Three challenges consistently surface: data quality and governance readiness (poor data produces misleading AI outputs), security and compliance (vendors must meet SOC 2, HIPAA, and data privacy standards), and change management. Building user trust across business teams requires transparency, training, and early wins that demonstrate clear value.
Is AI-powered business intelligence secure for sensitive enterprise data?
Security depends on the vendor. Look for SOC 2 Type II and HIPAA compliance, self-hosted deployment options for air-gapped environments, and explicit confirmation that customer data is never used to train AI models. Sylus meets all three requirements and supports flexible deployment models.
What is the future of AI in business intelligence?
The direction is toward autonomous AI agents that surface insights proactively, deeper integration with operational workflows, and more accurate predictive models as organizational data matures. That said, Gartner warns that over 40% of agentic AI projects will be canceled by end of 2027 due to cost overruns or unclear value—organizations should prioritize use cases with measurable ROI over chasing hype.