Introduction
Most reporting problems aren't about missing data — they're about the wrong data arriving too late. A periodic report is a structured document produced at regular intervals to communicate performance, progress, or status updates to key stakeholders.
The term covers two distinct contexts: internally, businesses use periodic reports to track KPIs and inform decisions; legally, public companies must file them with the SEC under the Exchange Act.
This article covers what periodic reports are, why they matter, what goes in them, and how to build one.
Key Takeaways
- A periodic report is a recurring document summarizing business performance for stakeholders on a weekly, monthly, quarterly, or annual schedule.
- Public companies must file SEC periodic reports (Forms 10-K, 10-Q, and 8-K) under the Exchange Act for regulatory compliance.
- Internally, periodic reports help monitor KPIs, identify trends, and enable smarter decisions consistently over time.
- To build one: define scope and frequency, gather data, structure your metrics, and distribute to the right audience.
- Common mistakes include inconsistent metrics, manual data errors, and reporting without clear context or narrative.
What Is a Periodic Report?
A periodic report is a formal, recurring document that captures business performance or status data over a defined time period, produced on a predictable schedule—weekly, monthly, quarterly, or annually. That schedule is what makes them useful: stakeholders can compare performance across equivalent periods and spot trends that one-off snapshots miss.
The term applies in two primary contexts: (1) internal business reporting, where management and data teams track operational, financial, or marketing KPIs; and (2) regulatory filing, where public companies are legally required to submit reports to the SEC under the Exchange Act.
In the regulatory context, Sections 12(a), 12(g), and 15(d) of the Exchange Act set the filing requirements. The core forms include:
- Form 10-K — annual report for US public companies
- Form 10-Q — quarterly update on financials and operations
- Form 8-K — filed when a material event occurs
- Form 20-F / Form 6-K — equivalents for foreign private issuers
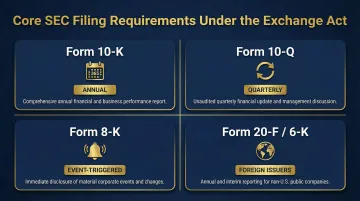
These filings ensure market transparency and investor protection.
For internal teams, the value is more immediate: a reliable reporting cadence means decisions get made on current data, not assumptions—and problems surface before they compound.
How It Differs from Other Report Types
A periodic report differs from other reporting formats in several ways:
- One-time reports (e.g., feasibility studies or post-mortems) are created for a specific purpose and never repeated.
- Ad hoc reports are triggered by specific events rather than a schedule, addressing unanticipated questions.
- Annual reports are a specific type of periodic report, typically broader and more narrative in scope, covering a full fiscal year.
The defining characteristic is the fixed schedule. That regularity is what enables meaningful period-over-period comparison—something neither ad hoc nor one-time reports can provide.
Why Businesses Use Periodic Reports
Scheduled, recurring reporting is essential for operational management. It creates a rhythm of accountability, surfaces trends that one-off snapshots miss, and aligns teams around shared metrics. According to Databox's 2023 State of Business Reporting survey, almost 60% of companies use standardized reports that include the exact same KPIs and charts every time they are generated.
For public companies, periodic reporting is not optional—it's mandated by the SEC to protect investors and maintain market transparency. Even for private companies, investors, boards, or lenders may contractually require regular reporting to monitor performance and risk.
Without periodic reports, organizations lose visibility into their own performance. Gartner notes that poor-quality decisions from a lack of financial context can cost up to 3% of an organization's earnings. The gaps show up in predictable ways:
- Decision-makers act on incomplete or stale data
- Performance problems go undetected until they become critical
- There's no baseline for comparing results over time
Forrester research found that organizations using structured decision frameworks achieved a 26% higher success rate for major initiatives and reached time-to-value 50% faster — a direct return on the discipline of consistent reporting.
What a Periodic Report Typically Contains
Most periodic reports share core components that ensure clarity and actionability:
- Executive summary – A high-level overview of key findings and conclusions
- Key metrics or KPIs – The most important performance indicators for the audience
- Period-over-period comparisons – Trends showing how metrics have changed over time
- Data visualizations – Charts and tables that make trends scannable
- Analysis or narrative context – The "so what" behind the numbers
- Recommended actions or next steps – Specific guidance based on the data
Contents vary by report type and audience. A weekly sales report focuses on pipeline and conversion; a quarterly financial report covers revenue, margins, and cash flow; an SEC Form 10-Q includes balance sheets, income statements, and statements of cash flows alongside non-financial disclosures.
Across all of these formats, the narrative layer is what separates a useful periodic report from a raw data dump. Stakeholders need context, not just figures. Each key metric should be accompanied by context: Is the number up or down vs. last period? Why? What does it mean for the business?
How to Create a Periodic Report
Creating a periodic report involves defining what to measure, collecting the right data, structuring it for clarity, and distributing it to the right audience on a consistent schedule. The five steps below walk through each stage of that process.
Step 1: Define Scope, Audience, and Frequency
Before any data is gathered, answer these questions: Who is this report for? What decisions should it inform? What time period does it cover, and how often will it recur?
Vague scope leads to bloated reports that no one reads. Focus on the 5-10 metrics that actually drive decisions for the audience. Match frequency to your team's decision-making cadence:
- Weekly for operational teams
- Monthly for department reviews
- Quarterly for executives and boards
- Annually for investors or regulatory bodies
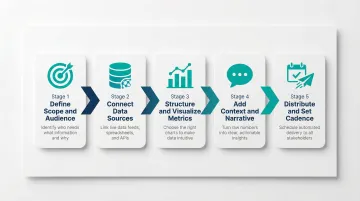
Step 2: Identify and Connect Your Data Sources
A periodic report is only as reliable as its data. Common source types include:
- CRMs (customer relationship management systems)
- Financial systems and accounting platforms
- Product analytics and usage tracking tools
- Databases and data warehouses
- Spreadsheets (Excel, Google Sheets)
The challenge: When data lives in siloed tools, manual aggregation creates delays and errors. Gartner estimates that poor data quality costs organizations an average of $12.9 million annually, and MIT Sloan research indicates 47% of newly created data records contain at least one critical error.
Modern data teams use connected analytics platforms to query live data directly. Sylus, for example, lets teams connect 500+ data sources—including databases, CRMs, accounting platforms, and product analytics tools—and ask questions in plain English. The platform auto-generates dashboards, charts, and AI-written summaries ready to share or schedule to email or Slack. By grounding all analysis in dbt models and documentation, Sylus ensures metric consistency across reporting periods.
Step 3: Structure and Visualize the Metrics
Structure the report logically:
- Lead with a summary
- Present the most important metrics first
- Use visualizations to make trends scannable
- Group related metrics together
Choose chart types that match the data:
- Line charts for trends over time
- Bar charts for comparisons across categories
- Pie charts for categorical breakdowns
- Tables for detailed metrics and granular data
Sylus recommends chart types automatically based on your data structure and lets users adjust those visualizations by typing what they want to change.
Step 4: Add Context and Narrative
Each key metric should be accompanied by brief context:
- Is the number up or down vs. last period?
- Why did the change occur?
- What action, if any, does it call for?
This narrative transforms raw data into actionable insight for the reader. AI-powered platforms can generate these narrative summaries automatically — analyzing trends, flagging anomalies, and surfacing the "so what" alongside every chart.
Step 5: Review, Distribute, and Establish a Cadence
Internal review for accuracy:
- Spot-check formulas and calculations
- Verify data freshness
- Confirm metric definitions are consistent
Distribution via the appropriate channel:
- Email (scheduled delivery)
- Slack (automated alerts and summaries)
- Embedded dashboards (within websites or products)
- Shareable links (for quick distribution)
- PDF exports (for formal documentation)
Set a recurring schedule so reports go out automatically. Sylus supports scheduled reports and AI-generated summaries sent to email or Slack channels, and enables activity-based alerts that notify teams about spikes in KPI metrics between scheduled reporting cycles.
Common Mistakes in Periodic Reporting
Even well-intentioned reporting processes break down in predictable ways. Here are the three mistakes that most often undermine periodic reports.
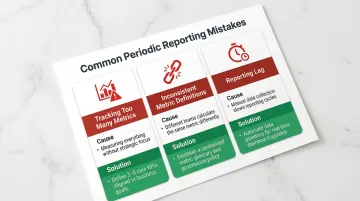
Tracking Too Many Metrics
When every number is highlighted, nothing is. Reports should focus on the 5–10 metrics that actually drive decisions for the audience. Avoid the temptation to include every available data point — more coverage rarely means more clarity.
Inconsistent Definitions Across Periods
If "revenue" is defined differently quarter to quarter, trend comparisons become meaningless. Document metric definitions and enforce a single source of truth across all reports. Using dbt models to standardize calculation logic ensures metrics are computed consistently every time. Platforms like Sylus integrate with dbt to ground all analysis in governed context, eliminating metric drift between reporting cycles.
Reporting Lag
A monthly report delivered three weeks late loses its utility. Manual data gathering is the most common culprit. Gartner notes that delayed reporting and data silos severely impact decision speed. Automating data pipelines and using scheduled report generation tools solves both problems.
Frequently Asked Questions
What is a periodic report?
A periodic report is a recurring document—produced on a set schedule (weekly, monthly, quarterly, or annually)—that summarizes business performance or status updates for stakeholders. The term applies both to internal business reporting and to SEC-mandated filings for public companies.
What is an example of a periodic report?
Common examples include:
- A monthly sales dashboard shared with the leadership team
- A quarterly financial review presented to the board
- A weekly product metrics summary sent to the engineering team
- An SEC Form 10-Q filed quarterly by a public company
What is the difference between a periodic report and an annual report?
An annual report is a specific type of periodic report covering a full fiscal year—often the most comprehensive and formal version. Periodic reports also include monthly, quarterly, and weekly reporting cycles.
How often should a business create a periodic report?
Frequency should match the decision-making cadence for the audience: weekly for operational teams, monthly for department reviews, quarterly for executives and boards, and annually for investors or regulatory bodies.
How much does it cost to file a periodic report in Colorado?
Colorado requires LLCs and corporations to file a periodic report with the Secretary of State annually. According to the Colorado SOS fee schedule, the online filing fee is $25, with a $50 late filing penalty and a $100 reinstatement fee if the entity becomes delinquent.
What happens if you don't file a periodic report in Colorado?
Missing the filing deadline puts your business in bad standing with the Colorado Secretary of State and can lead to administrative dissolution, which strips the entity of its legal right to operate. Reinstatement costs $100 and requires sworn affidavits along with government-issued ID verification.