Introduction
Modern data teams face a mounting challenge: data volumes grow faster than teams can analyze them manually, and static dashboards no longer keep pace with business decisions. A 2024 McKinsey study found that AI-driven forecasting reduces errors by 20% to 50%, while predictive maintenance analytics cut equipment downtime by 30% and maintenance costs by 18%. The numbers make the case: AI doesn't just speed up analytics—it changes how decisions get made.
This guide covers what AI analytics is, how it transforms each stage of the analytics workflow, real-world use cases, key benefits, honest limitations, and how to get started.
Key Takeaways
- AI automates data prep, analysis, and visualization—giving teams faster, more reliable answers from their data
- Natural language querying lets any team member ask questions in plain English without SQL knowledge
- Predictive models uncover patterns and forecast outcomes that manual analysis would likely miss
- Platforms like Sylus ground AI exploration in governed dbt models for trusted, consistent results
- Start small with one measurable problem and validated data before scaling AI analytics
What Is AI Analytics?
AI analytics uses machine learning, natural language processing, and automation to analyze data, uncover patterns, and generate insights faster and at greater scale than traditional manual methods. It transforms analytics from a consultative, analyst-dependent process into an automated decision engine accessible to any team member.
The 4 Types of Data Analytics Explained
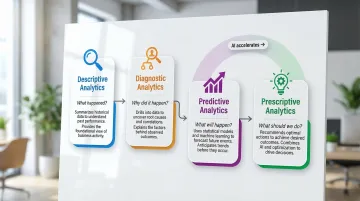
Understanding where AI fits requires knowing the four analytics types:
| Type | Core Question | What It Does |
|---|---|---|
| Descriptive | What happened? | Summarizes historical data — dashboards showing last quarter's revenue, traffic, or sales by region |
| Diagnostic | Why did it happen? | Identifies root causes via drill-downs and correlations (e.g., fewer leads vs. lower conversion rates) |
| Predictive | What will happen? | Uses statistical models and ML to forecast demand, churn, or revenue from historical patterns |
| Prescriptive | What should we do? | Recommends specific actions based on predicted outcomes — the most advanced and least widely adopted type |
Where AI Fits Into the Picture
AI accelerates predictive and prescriptive analytics while making descriptive and diagnostic work more automated and accessible. The practical result shows up most clearly in how the day-to-day workflow changes.
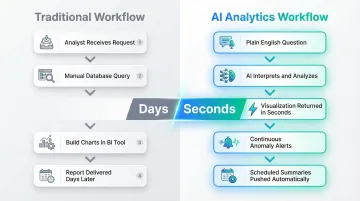
Traditional analytics workflow:
- Analyst receives request
- Manually queries database
- Builds charts in BI tool
- Delivers report days later
AI analytics workflow:
- User asks question in plain English
- AI interprets query, runs analysis, validates assumptions
- Returns visualization and summary in seconds
- Continuous monitoring alerts teams to anomalies
- Scheduled summaries push findings to email or Slack automatically
Sylus is built around this workflow — connect your data sources, ask questions in plain English, and get full dashboards back in seconds. All analysis runs on governed context tied to your dbt models and documentation, so every insight maps back to your team's trusted metric definitions rather than ad hoc queries.
How AI Transforms Each Stage of the Analytics Workflow
Data Collection and Preparation
AI automates data ingestion from multiple structured and unstructured sources—databases, APIs, documents, emails, social feeds—without requiring custom pipelines for each. This is especially valuable for teams managing data across business units or real-time streams.
How AI-powered data cleaning works:
- Automatically identifies anomalies and outliers
- Fills or flags missing values based on context
- Standardizes formats (dates, currencies, naming conventions)
- Joins datasets from disparate sources
This reduces manual prep time significantly—often by hours per analyst per week and improves downstream analysis quality. Instead of spending hours cleaning spreadsheets, data teams focus on interpreting results and guiding strategy.
Analysis and Pattern Detection
With clean data in place, machine learning models continuously scan large datasets to uncover correlations, trends, and anomalies that manual analysis would miss at scale—running in near real-time rather than on scheduled batch cycles.
Instead of waiting for weekly reports to spot problems, teams get alerts when something unusual happens and can investigate immediately. For example, Sylus detects activity spikes and sends Slack alerts like "I just noticed a large spike in usage for your project," enabling rapid response.
According to Deloitte's 2025 supply chain research, AI-enabled predictive analytics reduces equipment downtime by 20% to 30% by identifying failure patterns before they escalate—a margin that's difficult to achieve when teams are reviewing reports days after the fact.
Visualization and Decision-Making
Natural language querying (NLQ) lets users ask questions in plain English—like "What were our top revenue drivers last quarter?"—and AI interprets the query, runs the analysis, and returns a clear visual result without requiring SQL knowledge or BI expertise.
AI automatically generates charts, dashboards, and plain-language summaries from raw analysis, making findings accessible to non-technical stakeholders. This reduces the bottleneck between data teams and business users.
For instance, when a user asked Sylus "@sylus show me my top customers plz" in Slack, the platform instantly returned a bar chart identifying OpenAI as the top customer with an average order value of $4,028.11—demonstrating how natural language interfaces democratize data access.
Real-World AI Analytics Use Cases
AI analytics applies differently depending on the function — but the pattern is consistent: faster decisions, fewer manual steps, and signals that raw data alone can't surface. Here's how it plays out across four core business areas.
Marketing and Sales
Revenue teams use AI to move beyond gut instinct. Models identify which leads are most likely to convert, which customers are at risk of churning, and which messages will land — giving sales and marketing teams clear signals that CRM data alone can't produce.
Example applications:
- Predicting customer lifetime value based on purchase history and engagement
- Scoring leads by conversion probability to prioritize outreach
- Analyzing social media sentiment to guide messaging strategy
- Personalizing email campaigns based on behavioral patterns
Finance and Risk
AI powers fraud detection by flagging transaction anomalies in real time, credit risk assessment, and predictive financial forecasting.
Key capabilities:
- Real-time fraud detection analyzing transaction velocity, location, and amount
- Credit scoring incorporating non-traditional data sources
- Cash flow forecasting accounting for seasonality and market conditions
- Regulatory compliance monitoring across transactions
Operations and Supply Chain
AI-driven demand forecasting, predictive maintenance, and logistics optimization help product-based businesses reduce downtime, avoid stockouts, and respond to supply chain disruptions before they escalate.
A 2025 peer-reviewed study found that LSTM forecasting models reduced overstocking and stockouts, saving one Egyptian manufacturer approximately $168,450 annually. McKinsey reports that AI forecasting can reduce lost sales and product unavailability by up to 65%.
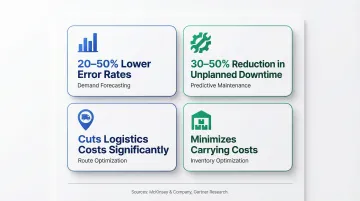
Operational benefits:
- Demand forecasting with 20-50% lower error rates than traditional methods
- Predictive maintenance reducing unplanned downtime by 30-50%
- Route optimization cutting logistics costs
- Inventory optimization minimizing carrying costs
HR and Product
AI handles the pattern-recognition work that makes HR and product decisions faster and more defensible. Teams can act on behavioral signals rather than waiting for lagging indicators like resignations or low feature adoption.
Where it shows up:
- Screening candidates against role requirements and historical hire data
- Predicting employee attrition before it shows up in exit interviews
- Personalizing product recommendations based on in-app behavior
- Prioritizing feature development using engagement and retention signals
Benefits of AI in Data Analytics
Speed and Scale
AI processes large, complex datasets far faster than manual methods and updates insights continuously. This enables a shift from static monthly reports to always-current intelligence that supports real-time decisions.
Teams no longer wait days for analyst availability — insights appear in seconds, and dashboards refresh automatically as new data arrives.
Democratization of Data Access
Natural language interfaces lower the barrier for non-technical business users to explore data independently. Sylus embodies this shift by letting teams connect data sources and ask questions in plain English, generating full dashboards without writing SQL.
How this works in practice:
- Users ask conversational questions like "What were total sales for each sales rep from the last 12 months?"
- AI interprets the query and returns instant visualizations
- No SQL knowledge, BI training, or analyst intervention required
- Unlimited seats mean entire organizations can access data without per-user costs
The result: business users get answers on their own schedule, and data teams can focus on higher-order analysis instead of fielding routine queries.
Improved Accuracy and Pattern Detection
ML models reduce the risk of human error in data interpretation and surface subtle patterns (correlations, anomalies, emerging trends) that even experienced analysts miss in large datasets.
For example, AI can detect that customer churn correlates with a specific sequence of product interactions that human analysts wouldn't notice by reviewing reports manually. These insights drive proactive interventions that prevent revenue loss.
AI pattern detection typically surfaces:
- Anomalies in transaction or usage data before they escalate
- Correlations across datasets that span departments or time ranges
- Emerging trends weeks before they appear in standard reports
Challenges and Limitations to Know
Data Quality and Bias
AI outputs are only as reliable as the data they're trained on. Incomplete, biased, or inconsistent data leads to flawed predictions. Teams must invest in data governance and cleaning before expecting AI to deliver trustworthy insights.
Common data quality issues:
- Missing values that skew statistical models
- Inconsistent formatting across data sources
- Historical bias embedded in training data
- Outdated information that no longer reflects reality
Data validation, standardized definitions, and regular audits should all be in place before you deploy AI models against your data.
Transparency and the "Black Box" Problem
Some AI models are difficult to interpret, making it hard to understand how a conclusion was reached. Audit trails, reproducible workflows, and explainability controls help teams satisfy compliance requirements and defend their findings to decision-makers.
One practical approach: anchor AI exploration to validated data definitions rather than letting it query raw, ungoverned sources. Sylus is built on this principle — all analysis references your dbt models and documentation, so teams can trace exactly how a result was derived and confirm it reflects agreed-upon business logic.
Over-Reliance on Automation
AI accelerates analyst work, but it cannot replace human judgment, domain knowledge, or ethical accountability. The strongest analytics workflows combine AI-driven automation with deliberate human oversight at each decision point.
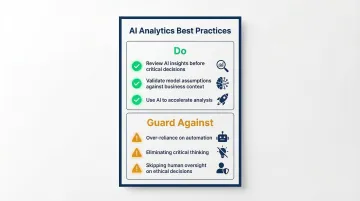
Best practices:
- Review AI-generated insights before making critical decisions
- Validate model assumptions against business context
- Maintain human oversight for ethical considerations
- Use AI to accelerate analysis, not eliminate critical thinking
Getting Started with AI Analytics
Start Small and Problem-First
The most successful AI analytics implementations begin by identifying one specific, measurable business problem—like churn prediction or demand forecasting—with accessible historical data and a defined success metric.
Effective starting points:
- Predicting which customers will churn next quarter
- Forecasting product demand to optimize inventory
- Identifying leads most likely to convert
- Detecting anomalies in transaction patterns
From there, clean data and stakeholder buy-in determine whether you can move quickly or need to invest in data prep first.
Build on a Governed Data Foundation
Bad data produces bad AI outputs — confidently wrong answers are worse than no answers. Before deploying any AI analytics tool, teams need clean, well-documented, and governed data in place.
Sylus tackles this directly: all analysis is grounded in your dbt models and documentation, so users query against trusted definitions rather than raw, ambiguous tables. That prevents the silent errors that undermine confidence in AI-generated insights.
Foundation requirements:
- Documented data models with clear definitions
- Validated transformations and business logic
- Consistent naming conventions across sources
- Regular data quality checks and audits
Measure ROI and Iterate
Before deploying AI tools, establish a baseline. Then track impact metrics—time saved, revenue influenced, error rates reduced—to demonstrate value and guide incremental improvements. Run A/B tests or pilot programs first; validating a model on a subset of users is far cheaper than unwinding a bad full rollout.
Metrics to track:
- Time from question to insight (before vs. after AI)
- Number of self-service queries by business users
- Forecast accuracy improvements
- Reduction in manual data preparation hours
- Revenue impact from AI-driven decisions
Sylus makes this reporting loop practical: scheduled AI-generated summaries delivered to email or Slack give teams a regular view of usage and impact without requiring manual report pulls.
Frequently Asked Questions
What is AI analytics?
AI analytics uses machine learning, NLP, and automation to analyze data, uncover patterns, and generate insights faster and at greater scale than traditional manual methods. The result is faster, more consistent analysis without relying on an analyst at every step.
How can AI be used in analytics?
AI automates the entire analytics workflow—data preparation, real-time pattern detection, natural language querying, and visualization generation—without requiring manual analyst intervention at each step. Users ask questions in plain English and receive instant insights.
What is an example of AI analytics?
A retail company uses AI to analyze customer purchase history and predict which products to stock ahead of demand spikes, or a SaaS company uses AI to identify customers at risk of churning before they cancel, enabling proactive retention efforts.
What are the benefits of AI in analytics?
AI analytics delivers three core benefits:
- Faster insights — results update continuously in real time rather than on a reporting cycle
- Improved accuracy — ML pattern detection surfaces subtle correlations that manual analysis misses
- Broader data access — non-technical users can explore data through natural language queries without writing SQL
What are the 4 types of data analytics?
Descriptive (what happened), diagnostic (why it happened), predictive (what will happen), and prescriptive (what should we do) analytics. AI primarily advances the predictive and prescriptive categories by automating forecasting and recommending specific actions.