Introduction
Predictive analytics appears across nearly every data-driven industry today. Banks use it to detect fraud in real time. Retailers forecast demand to optimize inventory. Healthcare providers identify high-risk patients before complications arise. This growing prevalence is inseparable from the rise of big data systems that make it possible at scale.
The numbers reflect this momentum: the global predictive analytics market is projected to grow from $18.89 billion in 2024 to $82.35 billion by 2030, a 28.3% compound annual growth rate. At the same time, global data generation reached 132,425 Exabytes in 2023 and is forecast to hit 393,852 Exabytes by 2028.
Organizations are investing heavily in predictive analytics capabilities — and big data infrastructure is what makes those investments viable.
Yet while many teams know these concepts individually, how they actually function as a connected system—from raw data collection to a usable forecast—is often unclear. This leads to poor tooling decisions, unrealistic expectations about what predictions can deliver, and missed opportunities to extract value from data already sitting in warehouses.
This guide explains exactly how predictive analytics and big data work together as an operational system — covering the architecture, the data flow, and where the real decisions get made.
Key Takeaways
- Predictive analytics forecasts future outcomes using historical data — big data supplies the scale and variety that makes those forecasts reliable
- Big data is raw material, not insight: it requires cleaning and modeling before predictions are possible
- The pipeline runs from data collection through preprocessing, model building, validation, and deployment
- Core techniques include regression, decision trees, and neural networks—each suited to different prediction problems
- Industries use this combination to reduce risk, personalize experiences, and improve decision-making
What Are Predictive Analytics and Big Data?
Predictive Analytics: Forecasting from Past Patterns
Predictive analytics uses historical data, statistical modeling, machine learning, and AI to identify patterns and forecast future events or behaviors. Unlike descriptive analytics, which summarizes what happened, predictive models are built to anticipate what comes next — and to minimize prediction error on new, unseen data.
That distinction shapes how models are built, evaluated, and deployed.
Predictive models fall into two main categories:
- Classification models produce binary outputs (yes/no decisions like churn or fraud)
- Regression models produce continuous outputs (revenue forecasts or demand volume)
The distinction matters because each model type requires different algorithms, evaluation metrics, and deployment strategies.
Big Data: The Fuel for Prediction
Big data is defined by three core characteristics introduced by Gartner analyst Doug Laney in 2001:
- Volume: The scale of data generated (terabytes, petabytes, exabytes)
- Velocity: The speed at which data flows into systems
- Variety: Structured, semi-structured, and unstructured formats
Two additional characteristics have since been added:
- Veracity: The accuracy and reliability of the data
- Value: The actionable insights organizations can extract
Traditional data-processing tools cannot handle big data's scale and complexity. Raw data at petabyte scale produces noise, not insight. Predictive analytics is what turns that volume into usable forecasts — applying models that extract signal from the noise and translate it into decisions.
How Predictive Analytics and Big Data Work Together
Predictive analytics and big data operate as a pipeline. Big data provides the raw material; predictive analytics is the processing engine that extracts forward-looking intelligence. Here's how each stage works.
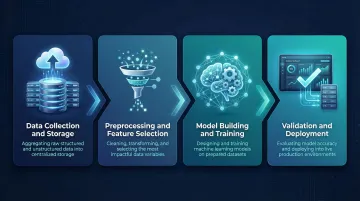
Stage 1 — Data Collection and Storage
Big data is ingested from multiple sources simultaneously:
- Transactional systems (sales, payments, orders)
- IoT sensors (equipment telemetry, environmental readings)
- Customer behavior logs (clicks, page views, session data)
- Social platforms (posts, comments, engagement metrics)
- CRM and ERP systems (customer records, supply chain data)
This data lands in scalable storage infrastructure such as data warehouses or data lakes, designed to hold and organize large, varied datasets in a way that makes them queryable for downstream modeling. For teams working with these systems, platforms like Sylus connect directly to 500+ data sources—including databases, CRM systems, and accounting platforms—enabling teams to access data without complex manual integration.
Stage 2 — Data Preprocessing and Feature Selection
Raw big data is not model-ready. It must be cleaned, standardized, and transformed before use. This stage involves:
- Removing errors, duplicates, and missing values
- Standardizing formats (dates, currencies, units)
- Transforming variables (normalization, encoding categorical data)
Feature selection determines which input variables most meaningfully influence the outcome being predicted. This reduces noise and prevents models from trying to learn from irrelevant data. In practice, this step often happens within dbt models and documentation, which structure and govern data before it reaches the analytics layer.
Stage 3 — Model Building and Training
Once data is prepared, a predictive model is trained on a historical dataset where outcomes are already known — learning statistical relationships between input variables and the target outcome. The core challenge is overfitting: when a model performs well on training data but fails on new, unseen data. This risk compounds in big data environments with large numbers of input variables. The goal is to optimize the bias-variance tradeoff:
- High bias (underfitting): The model is too simple to capture meaningful patterns between features and outcome
- High variance (overfitting): The model memorizes training data and breaks down on anything outside it
Techniques like regularization reduce model complexity by penalizing large weights, pushing them toward zero to reduce variance and improve generalization.
Stage 4 — Validation and Deployment
The trained model is tested against a separate held-out dataset to measure prediction accuracy and ensure results are reliable before deployment. Validation metrics vary by model type (accuracy, precision, recall for classification; RMSE, MAE for regression).
Once validated, models are deployed to stakeholders through dashboards, applications, or automated alert systems. Organizations put 11x more AI models into production in 2024 compared to 2023, with the ratio of experimental to production models improving from 16:1 to 5:1 in just one year.
The faster teams can interact with those deployed predictions — without waiting on SQL queries or engineering support — the shorter the gap between insight and action.
Predictive Modeling Techniques That Make Sense of Big Data
The choice of modeling technique depends on the type of prediction problem and the nature of the dataset. Big data environments typically use three core approaches.
Regression Analysis
Regression is a statistical technique that estimates relationships between variables. It's best suited for predicting continuous outcomes like revenue, inventory levels, or pricing effects from large structured datasets.
Logistic regression is the dominant technique for binary classification problems in big data applications. It's widely used for:
- Customer targeting (will they convert?)
- Fraud detection (is this transaction fraudulent?)
- Credit scoring (will they default?)
Decision Trees
Decision trees are classification models that divide data into branches based on distinct decision variables. They're well-suited for datasets with missing values and for problems where understanding individual decision paths matters.
Key advantages:
- Produce "white box" outputs — every decision path follows boolean logic, making results auditable and explainable to stakeholders
- Handle missing data natively by substituting alternate predictor fields (called surrogates) when primary values are absent
Common applications include customer behavior prediction and loan default forecasting.
Neural Networks
Where decision trees prioritize transparency, neural networks trade interpretability for raw pattern-recognition capability. They identify complex, nonlinear relationships across very large datasets — making them the right fit when the relationship between inputs and outputs can't be captured by a simple equation or decision rule.
Neural networks are universal function approximators — which makes them especially effective on unstructured data like images, text, and sensor streams. In practice, teams often run neural network outputs alongside regression or decision tree results to cross-validate predictions before acting on them.
Real-World Applications of Predictive Analytics and Big Data
The combination of predictive analytics and big data is applied across industries wherever there is sufficient historical data and a meaningful outcome to forecast. The same underlying workflow applies across contexts—only the data sources and target variables change.
Common applications include:
- Fraud Detection: Ensemble neural networks score transactions in real time. One bank recovered $1.5M/month in previously undetected fraud while clearing $1M in false positives.
- Customer Churn Prediction: CRM and product usage signals feed classification models that flag at-risk customers, giving teams time to intervene with retention offers.
- Predictive Maintenance: Siemens deployed this at a global automotive manufacturer, monitoring 10,000+ machines across 100 types — achieving ROI in under three months and cutting unplanned downtime by 50%.
- Demand Forecasting: SKU-level regression models help retailers balance inventory, reducing both stockouts and overstock.
- Clinical Risk Scoring: Patient history models stratify populations by risk, enabling proactive care for those most likely to experience complications.

Financial services, retail, healthcare, manufacturing, and telecom are the most operationally mature adopters — but the underlying pattern applies anywhere historical data maps to a forecastable outcome.
Conclusion
Predictive analytics does not work without big data. The scale, speed, and variety of big data is what makes predictions statistically meaningful. The modeling techniques of predictive analytics are what transform that raw data into usable, forward-looking insight.
For data teams and business leaders, understanding this pipeline—from data ingestion to model deployment—is essential for choosing the right tools, setting realistic expectations, and ensuring predictions actually drive better outcomes rather than sitting unused as an analytics artifact.
The dependency runs both ways. Without big data, models lack the training volume to produce reliable results. Without predictive analytics, big data stays descriptive rather than forward-looking.
The teams that get the most value from both treat them as a single, integrated system — and build their infrastructure, tooling, and workflows accordingly.
Frequently Asked Questions
What is predictive analytics in big data?
Predictive analytics in the context of big data refers to applying statistical and machine learning models to large, complex datasets to identify patterns and forecast future outcomes. Big data provides the volume and variety of inputs that make these predictions more accurate and generalizable across different scenarios.
How do big data and predictive analytics work together?
Big data serves as the raw input layer—collected, stored, and preprocessed—while predictive analytics provides the modeling layer that extracts forecasts from that data. The two work as a pipeline: without big data, models lack training volume; without predictive analytics, big data remains descriptive rather than forward-looking.
What are the 4 types of big data analytics?
The four types are descriptive (what happened), diagnostic (why it happened), predictive (what will likely happen), and prescriptive (what action to take). Predictive and prescriptive are the most operationally valuable — yet only 41% of organizations have deployed predictive analytics and 26% have deployed prescriptive analytics.
What are the main techniques used in predictive analytics?
The three core techniques are regression analysis (continuous outcomes and binary classification), decision trees (categorical decisions with interpretable outputs), and neural networks (complex, nonlinear patterns in high-dimensional data). Each suits a different class of prediction problem.
What are common real-world examples of predictive analytics using big data?
Common examples include credit scoring and fraud detection in banking, patient risk stratification in healthcare, demand forecasting in retail, and predictive maintenance in manufacturing.
What are the biggest challenges in using big data for predictive analytics?
Three key challenges stand out: data quality (errors in raw data degrade model accuracy), overfitting (models can memorize noise rather than learn generalizable patterns), and feature selection (with thousands of variables, identifying the most predictive ones demands significant expertise).