Introduction
Global data generation hit 149 zettabytes in 2024 and is projected to reach 181 zettabytes by the end of 2025. Despite this, 52-55% of enterprise data remains "dark" or unclassified, and up to 90% of sensor-generated data goes completely unanalyzed. More data isn't the problem — the gap is in turning it into decisions that actually move the business.
That's what big data analytics platforms are built to solve. This guide breaks down how they work, what categories exist, which platforms lead the market, and how to choose the right fit for your team's needs and technical maturity.
Key Takeaways
- Big data analytics processes massive, complex datasets to uncover patterns traditional tools can't handle
- Modern platforms use ELT pipelines, cloud warehouses, and AI to deliver insights in seconds rather than days
- Solutions range from infrastructure layers (Spark, Snowflake) to BI tools (Tableau, Power BI) to AI-native platforms that accept plain English questions
- Data-driven organizations are 19 times more likely to be profitable than their peers
- The right platform depends on your data stack maturity, primary users, and security requirements
What Is Big Data Analytics?
Big data analytics refers to the systematic processing and analysis of massive, complex datasets—both structured and unstructured—to extract valuable business insights that traditional tools cannot deliver at scale.
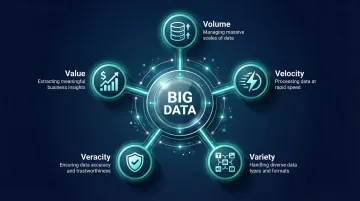
The 5 Vs of Big Data
The framework distinguishing big data from traditional data originated in a 2001 Meta Group research note by Doug Laney, defining the "3 Vs." IBM later expanded this to five dimensions:
- Volume — The sheer amount of data generated that overwhelms traditional database systems
- Velocity — The unprecedented speed at which data flows into systems, often in real-time streams
- Variety — The many formats data takes: structured databases, semi-structured JSON, unstructured text, images, video, and sensor readings
- Veracity — The accuracy, reliability, and trustworthiness of data, including noise and anomaly detection
- Value — The real-world business benefits organizations extract after processing
When all five dimensions exist simultaneously at enterprise scale, traditional SQL databases and spreadsheet tools break down. Big data analytics platforms use distributed computing, cloud-native architectures, and machine learning to process data volumes, speeds, and formats that legacy systems were never designed to manage.
Four Types of Analytics
Modern platforms support four analytical maturity stages:
| Analytics Type | Core Question | Primary Methods |
|---|---|---|
| Descriptive | What happened? | Historical summaries, dashboards, BI reporting |
| Diagnostic | Why did it happen? | Drill-down analysis, correlation detection, root cause investigation |
| Predictive | What will happen? | Machine learning models, statistical forecasting, trend projection |
| Prescriptive | What should we do? | Optimization algorithms, AI recommendations, automated decision-making |
Most platforms handle descriptive and diagnostic analytics well. The real competitive gap opens at the predictive and prescriptive levels—where analytics shifts from explaining the past to driving decisions automatically, often before a human analyst would notice the signal.
How Big Data Analytics Works
Modern big data pipelines follow a five-stage architecture: ingestion, integration, storage, analysis, and delivery.
Data Ingestion and the ELT Revolution
Raw data enters the system from multiple sources:
- Databases and SaaS applications
- APIs and event streams
- IoT sensors and connected devices
This data is ingested either in scheduled batches or real-time streams into a centralized repository.
The traditional ETL (Extract, Transform, Load) approach extracted data, transformed it on a separate server, then loaded it into the target database. This worked for small, structured datasets but created bottlenecks at scale.
Modern architectures use ELT (Extract, Load, Transform): data is extracted and loaded in its raw state directly into a cloud data warehouse, where transformations occur just before analysis. This approach leverages the massive parallelization and compute power of platforms like Snowflake and BigQuery, eliminating separate transformation infrastructure and accelerating time-to-insight.
Data Preparation: The Persistent Bottleneck
Once data is ingested, it must be cleaned, standardized, and transformed before analysis. Tools like Apache Spark handle distributed processing for large-scale workloads, while dbt (data build tool) has become the industry standard for SQL-based transformations within cloud warehouses.
Despite tooling improvements, data preparation remains the primary time sink. A widely cited 2016 study found data scientists spent 80% of their time on data preparation. 76% of analysts still rely on manual spreadsheets for data preparation in 2025, with nearly half spending over six hours per week on cleansing tasks.
Storage Architecture: Lakes, Warehouses, and Lakehouses
Data lakes store vast amounts of raw data in native formats using a schema-on-read approach. They're ideal for exploratory analysis and machine learning but lack the query performance of structured systems.
Data warehouses store structured, processed data optimized for fast SQL queries using a schema-on-write approach. Cloud platforms like Snowflake, BigQuery, and Redshift excel at business intelligence workloads.
Data lakehouses combine the flexibility and scale of lakes with the management and ACID transactions of warehouses, representing the modern architectural standard for enterprises handling both structured and unstructured data.
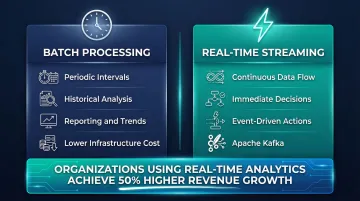
Analysis: Batch vs. Real-Time Processing
With storage in place, the actual analysis begins — analysts, data scientists, or AI-powered tools run queries, apply machine learning models, and surface patterns. Two processing paradigms dominate:
- Batch processing analyzes historical data periodically (hourly, daily, weekly) and suits reporting and trend analysis
- Real-time streaming analytics processes data as it arrives for immediate decisions, using tools like Apache Kafka for event streaming
Organizations in the top quartile of "real-time-ness" achieve 50% higher revenue growth and net margins compared to laggards, demonstrating the competitive advantage of streaming architectures.
The Last Mile: Insight Delivery
Insights reach end users through dashboards, scheduled reports, alerts, or natural language interfaces. This final step often determines whether value is captured or lost — analytics infrastructure that doesn't surface answers in consumable formats, at the right time, delivers nothing.
Types of Big Data Analytics Solutions
Data Infrastructure Platforms
This foundational layer handles data storage, processing, and pipeline orchestration. Key technologies include:
- Apache Spark — Distributed processing engine with in-memory capabilities for large-scale analytics workloads
- Apache Kafka — Event streaming platform for publishing, subscribing to, and processing real-time data streams
- Cloud-native services — AWS EMR, Google Dataproc, and Azure HDInsight provide managed infrastructure without hardware overhead
These tools are typically managed by data engineers and serve as prerequisites for analytics layers above them.
BI and Visualization Platforms
Traditional business intelligence tools sit atop data warehouses to provide dashboards and reporting:
- Tableau — Broad connector support with strong drag-and-drop visual exploration for analysts
- Microsoft Power BI — Deep integration with Microsoft 365 and Azure, making it a natural fit for Microsoft-stack enterprises
- Qlik — Associative analytics engine that surfaces hidden relationships across datasets without pre-defined queries
- Looker — Google-owned platform with LookML modeling layer for governed self-service analytics
These platforms excel at dashboarding and self-service reporting but typically require pre-built data models and SQL knowledge to unlock deeper analysis.
AI-Native Analytics Platforms
The emerging category of AI-native platforms allows users to query data in plain English and receive AI-generated insights, dashboards, and summaries—removing the need for SQL expertise:
- ThoughtSpot — Search-driven analytics with AI-generated "SpotIQ" insights
- Sisense — Single-stack solution for combining and analyzing large, multi-source datasets without IT involvement
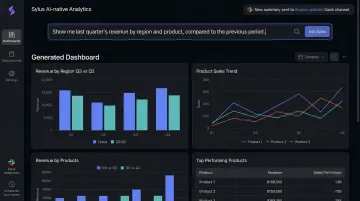
- Sylus — AI-powered platform that generates full dashboards from natural language questions, grounds analysis in dbt models and documentation for governed context, and can be queried directly from Slack or scheduled to deliver AI-generated summaries to email
This category is most valuable for business teams who need answers in seconds—without waiting in an analyst queue.
The Leading Big Data Analytics Platforms
The big data market reached $220.2 billion in 2023 and is projected to hit $401.2 billion by 2028, driven by cloud adoption and AI implementation.
Cloud Data Warehouse Leaders
Snowflake features an architecture that decouples storage and compute, allowing them to scale independently. It supports multi-cluster virtual warehouses for high concurrency and operates across AWS, Azure, and GCP. As of January 2025, Snowflake reported 11,159 total customers and $3.46 billion in annual product revenue.
Google BigQuery offers a fully managed, serverless architecture requiring zero infrastructure management. It features built-in BigQuery ML, allowing analysts to train machine learning models using standard SQL. Google Cloud's annualized revenue run rate exceeded $70 billion in Q4 2025, heavily driven by BigQuery and AI products.
Amazon Redshift provides a large-scale data warehouse based on PostgreSQL with deep AWS ecosystem integration and fine-grained access controls according to SQL standards.
BI Platform Differentiators
Tableau enables limitless visual data exploration with an intuitive interface and massive breadth of native data connectors to deploy analytics wherever data resides.
Microsoft Power BI deeply integrates with Microsoft 365 (Teams, Excel, PowerPoint) and Azure data services, offering a unified data foundation with OneLake and Direct Lake mode for high performance without data movement.
Qlik uses a proprietary Associative Engine that allows users to explore data freely in any direction without the linear restrictions and blind spots of traditional query-based tools.
AI-Augmented Analytics Leaders
ThoughtSpot focuses on search-driven analytics and AI-powered SpotIQ insights, allowing users to ask data questions using a business-friendly search interface.
Looker (acquired by Google for $2.6 billion in 2019) differentiates itself with LookML, a centralized semantic modeling language that ensures consistent business metrics across the enterprise.
Sylus grounds all analysis in governed context — connecting directly to data sources, dbt models, and dbt documentation so that every query runs against consistent, validated business definitions. Teams ask questions in plain English; the platform generates full dashboards, validates assumptions, and delivers AI-generated summaries on a schedule to email or Slack.
For enterprise data teams, Sylus offers SOC 2 Type II and HIPAA compliance, self-hosted deployment options, and unlimited user seats on usage-based pricing — making it practical for both fast-growing startups and F1000 data organizations.
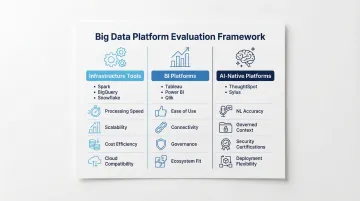
Evaluation Framework
When comparing platforms:
- Infrastructure tools (Spark, BigQuery, Snowflake) — Evaluate on processing speed, scalability, cost efficiency, and cloud compatibility
- BI platforms (Tableau, Power BI, Qlik) — Assess ease of use, data connectivity breadth, governance capabilities, and existing ecosystem integration
- AI-native platforms (ThoughtSpot, Sylus) — Evaluate natural language accuracy, semantic layer or governed context support, security compliance certifications, and deployment flexibility (cloud vs. self-hosted)
Benefits and Challenges of Big Data Analytics
Key Benefits
- Replaces intuition with data-backed decisions — data-driven organizations are 19 times more likely to be profitable, 23 times more likely to acquire customers, and six times more likely to retain them
- Surfaces bottlenecks, waste, and underperforming processes across supply chains, marketing spend, and product development cycles
- Turns behavioral data and purchase history into actionable personalization, improving retention and customer lifetime value
The gains are real — but so are the obstacles most teams hit along the way.
Common Challenges
- Siloed systems, inconsistent formats, and legacy infrastructure make clean, analytics-ready data hard to achieve — data preparation typically consumes the majority of analyst time, leaving little capacity for actual insight generation
- Traditional tools require SQL expertise or data engineering training, limiting insights to a small technical team; 78% of organizations lack strategic AI deployment plans, and only 3% of US LinkedIn members list AI skills on their profiles — modern AI-native platforms open access to insights for non-technical users through natural language interfaces
- Large volumes of sensitive data create real exposure around access control, GDPR and HIPAA compliance, and the risk of AI models training on proprietary data; enterprise-grade platforms address this through self-hosted deployment, SOC 2 Type II certification, strict data usage policies, and Business Associate Agreements for healthcare
How to Choose the Right Big Data Analytics Solution
Assess Your Data Stack Maturity First
Teams without a structured data warehouse or dbt models need infrastructure-layer investments before analytics tools add value. Teams with mature data stacks can move directly to analytics and AI layers.
Start by auditing your current data infrastructure:
- Do you have centralized data storage (warehouse or lake)?
- Are data pipelines automated or manual?
- Do you have documented data models and business logic?
- Is data refreshed in real-time or batch?
If your answers reveal infrastructure gaps, prioritize tools like Snowflake, BigQuery, or Databricks before investing in visualization layers.
Match the Tool to Your Primary Users
Data engineers and scientists who write SQL and build models are best served by infrastructure platforms with modeling layers — think Looker with LookML or dbt for transformations. They value control, customization, and technical depth.
Business analysts and executives who need answers without writing queries need something different: AI-native platforms with natural language input, automated dashboards, and Slack integration. Speed and accessibility matter more than technical control.
Most organizations need both. Infrastructure tools handle the engineering layer; AI-native interfaces serve the business users consuming those insights.
Evaluate Security, Deployment, and Total Cost
Confirm critical requirements before procurement:
Deployment flexibility: Regulated industries like healthcare and finance often require air-gapped environments. Confirm whether the vendor supports on-premises or self-hosted deployment before going further.
Compliance certifications: SOC 2 Type II, HIPAA, and GDPR readiness are non-negotiable for enterprise procurement. Sylus holds both SOC 2 Type II and HIPAA certifications.
Pricing model: Per-seat licensing gets expensive fast. Usage-based models — like Sylus's unlimited-seat structure — tend to be more cost-effective for growing teams.
Data training policies: Some platforms use customer data to train their AI models. Sylus and its model partners explicitly prohibit this, protecting your intellectual property and sensitive information.
Frequently Asked Questions
What are the big data solutions?
Big data solutions fall into three layers: infrastructure platforms for storage and processing, BI and visualization tools for dashboards and reporting, and AI-native analytics platforms for natural language querying and automated insight generation. The right mix depends on where your team sits in the analytics maturity curve.
What software is used in big data analytics?
Common tools include Apache Spark and Kafka for distributed processing, Snowflake and BigQuery for cloud warehousing, and Tableau or Power BI for visualization. AI-native platforms like Sylus add a layer on top—letting teams query data in plain English and generate dashboards automatically without writing SQL.
What is the difference between big data analytics and traditional data analytics?
Traditional analytics works on structured, smaller datasets using SQL and spreadsheets, typically handling gigabytes of data with single-server processing. Big data analytics handles massive volumes (terabytes to petabytes) of structured and unstructured data using distributed computing, machine learning models, and AI—enabling analysis at a scale and speed traditional tools cannot support.
What are the four types of big data analytics?
The four types are descriptive (what happened), diagnostic (why it happened), predictive (what will happen), and prescriptive (what action to take). Most platforms cover the first two well; predictive and prescriptive capabilities vary significantly and typically require ML models or AI-native tooling.
Is big data analytics only for large enterprises?
No. While the term originated in enterprise contexts, cloud-based and AI-native platforms have dramatically lowered the barrier to entry. Modern solutions offer usage-based pricing, serverless architectures, and no-code interfaces that make big data analytics accessible and cost-effective for fast-growing startups and mid-market companies as well.
How important is data governance in a big data analytics platform?
Governance is critical for ensuring analysis is based on trusted, consistent metrics. Platforms that ground analysis in documented data models—such as dbt documentation—reduce the risk of conflicting definitions and give both data teams and business users confidence in outputs. Without it, different teams generate conflicting reports, undermining confidence in every decision that follows.