Introduction
Organizations today face a paradox: they're drowning in historical data yet still making reactive decisions. Sales teams respond to churn after customers leave. Supply chains scramble to fix stockouts after shelves empty. Finance departments assess risk only after fraud occurs. The gap between data abundance and proactive action costs businesses billions annually in missed opportunities and preventable losses.
Predictive analytics bridges this gap. It's the practice of using historical data, statistical models, and machine learning to forecast future outcomes—turning backward-looking reports into forward-looking decisions. This guide breaks down the techniques behind it, the industries using it, and how AI platforms are putting these capabilities in the hands of business users, no coding required.
TLDR: Key Takeaways
- Predictive analytics transforms historical data into probability-based forecasts that answer "What will happen next?"
- Core techniques include regression, decision trees, neural networks, and time series models like ARIMA
- Applications span credit scoring, patient readmission prevention, inventory optimization, and personalized marketing
- AI platforms now let business users query data in plain English and generate forecasts without SQL expertise
- Sylus lets business users connect their data sources, ask questions in plain English, and generate shareable dashboards automatically
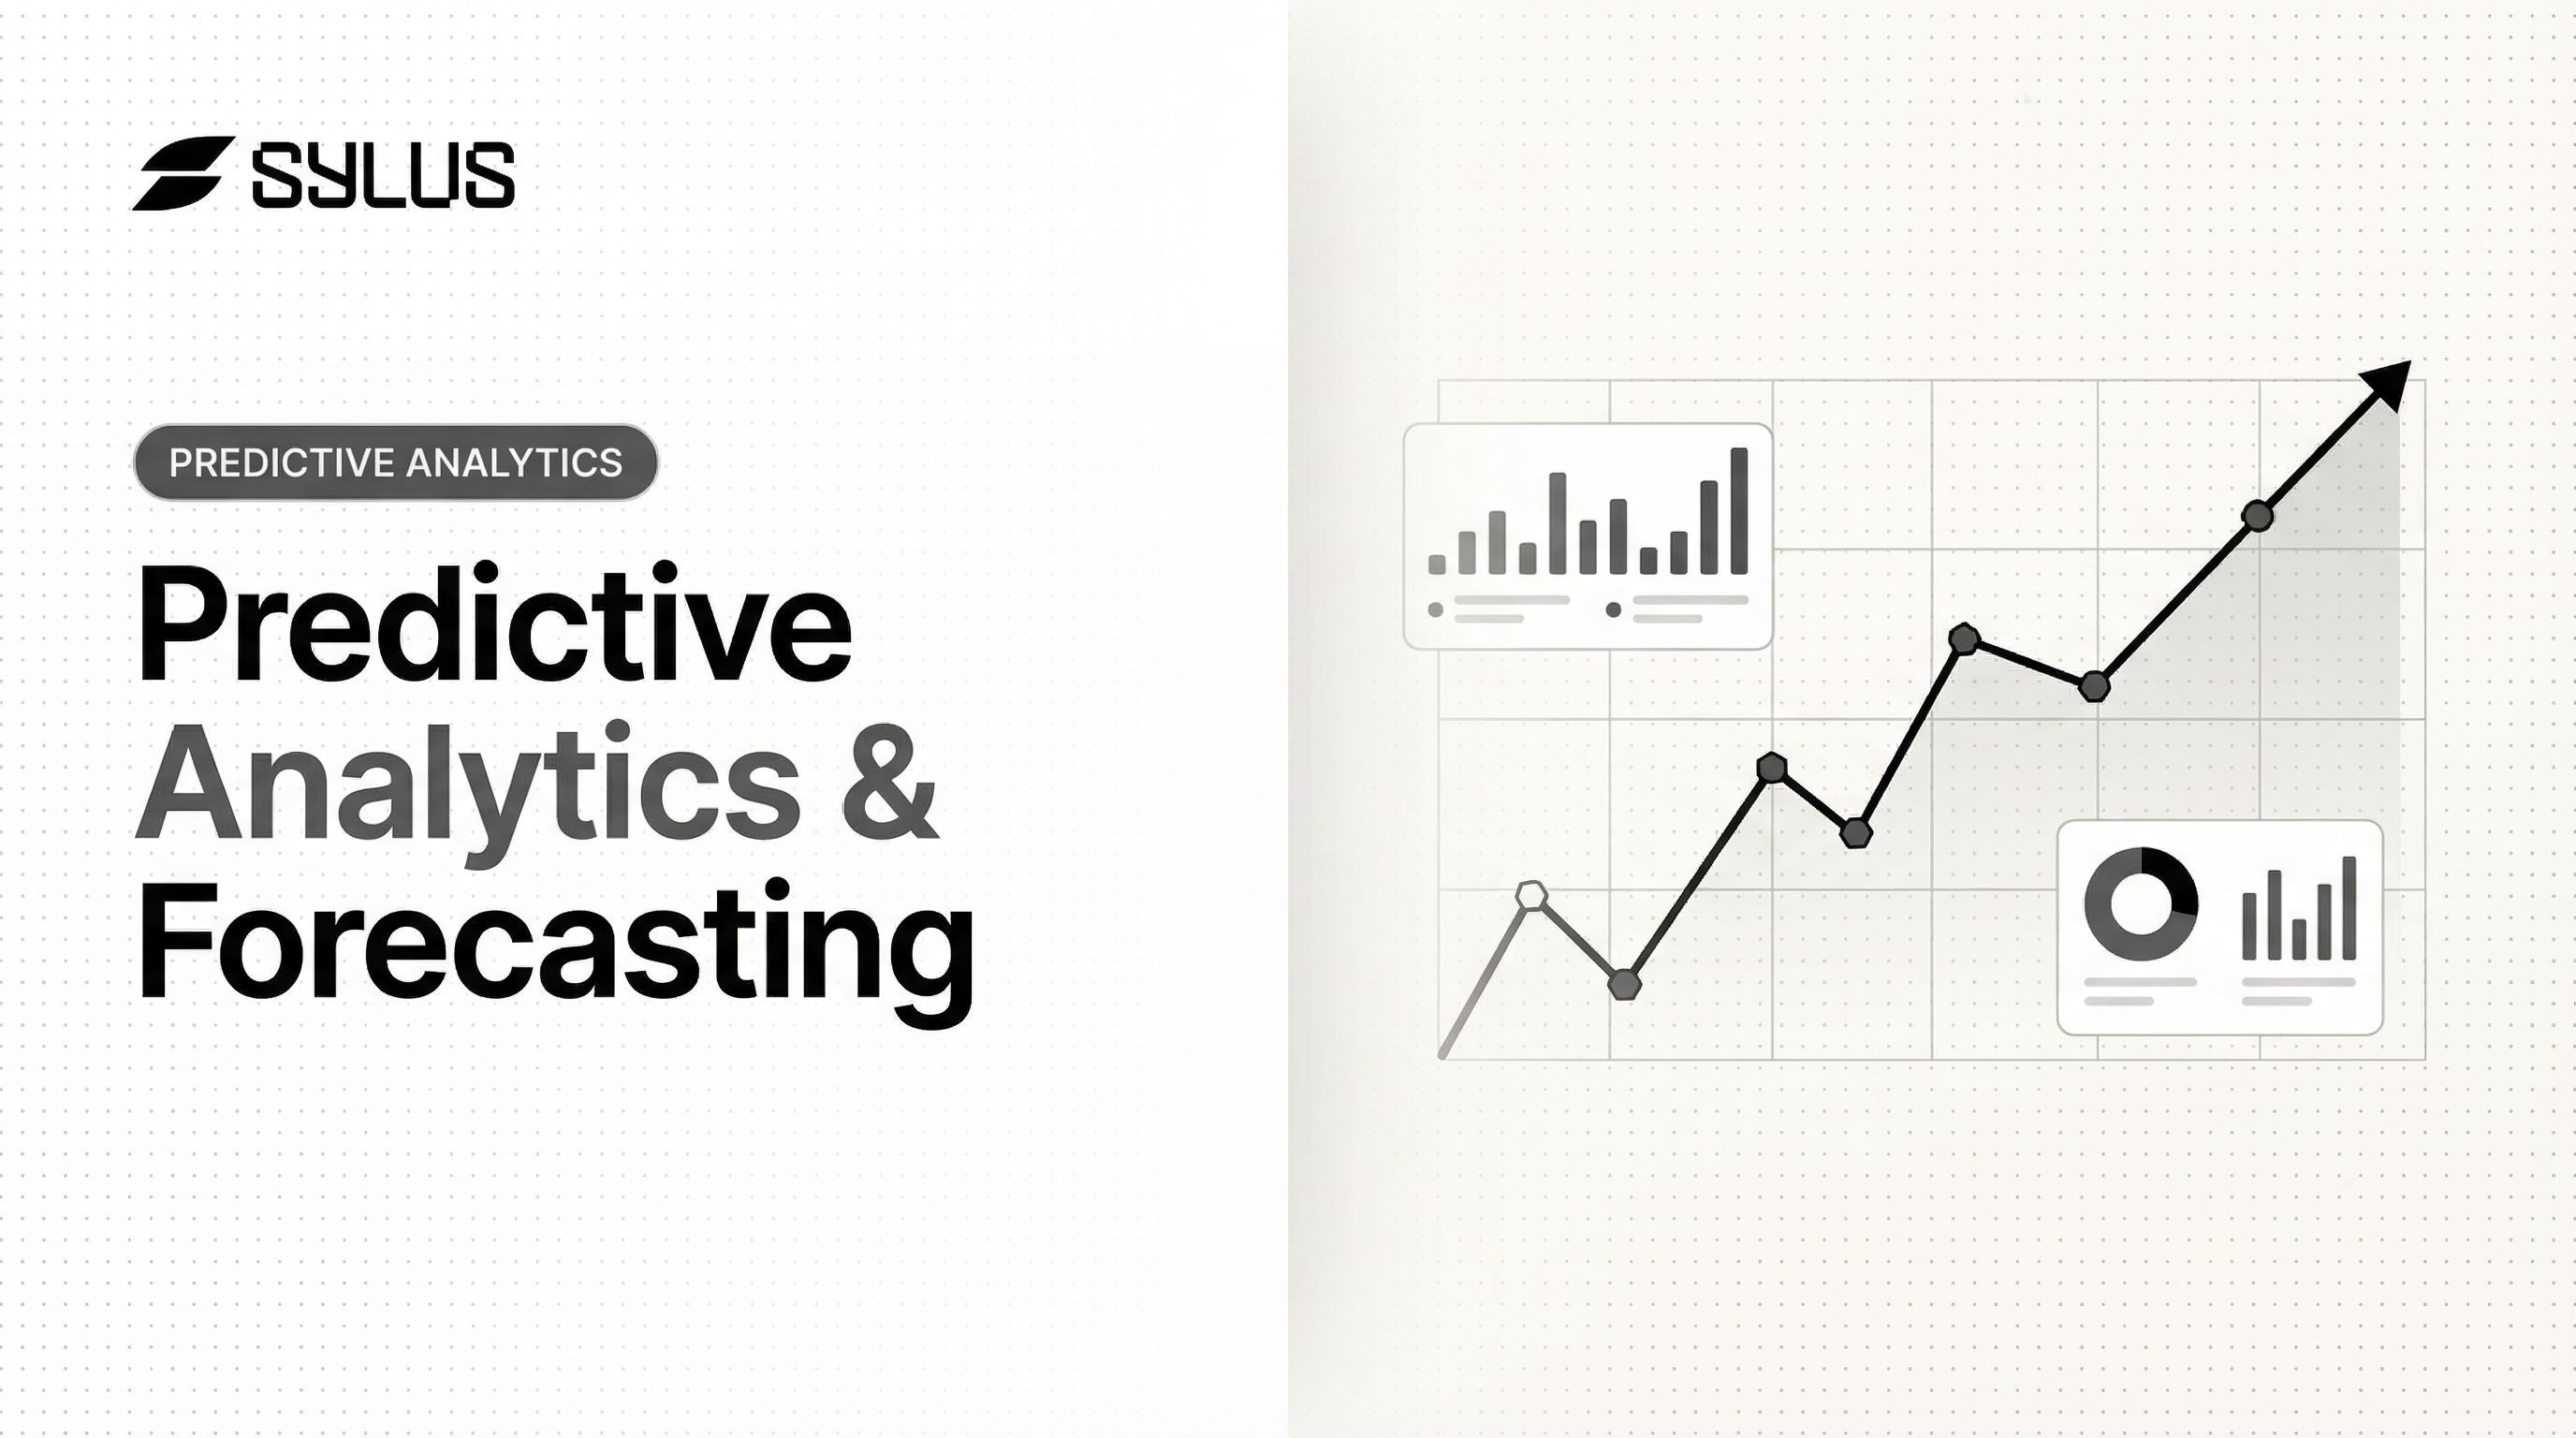
What Is Predictive Analytics?
Predictive analytics is a branch of advanced analytics that uses historical and current data, combined with statistical modeling and machine learning, to identify patterns and forecast future outcomes. Unlike descriptive analytics (which tells you what happened) or diagnostic analytics (which explains why it happened), predictive analytics is forward-looking—it answers "What is likely to happen next?"
The output is typically a probability score or forecast. Will this customer churn in the next 30 days? What's the likelihood this transaction is fraudulent? How much revenue should we expect next quarter? These questions require predictive models—mathematical representations trained on past data to estimate future values.
Forecasting is a specific application within this discipline—focused on time-based projections like quarterly sales or monthly demand. Predictive analytics is the broader field, covering classification (will this loan default?), risk scoring (fraud probability), and behavioral prediction (which customers will respond to an offer?).
The Analytics Maturity Model
| Analytics Type | Question Answered | Output |
|---|---|---|
| Descriptive | What happened? | Historical reports and dashboards |
| Diagnostic | Why did it happen? | Root cause analysis |
| Predictive | What will happen? | Probability scores and forecasts |
| Prescriptive | What should we do? | Recommended actions |
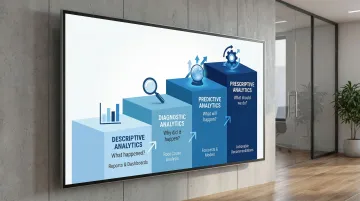
Looking at these four tiers together, predictive analytics sits between understanding the past and automating future decisions. It tells you what to expect—but doesn't execute the final action. That's where prescriptive analytics takes over.
How Predictive Analytics Works
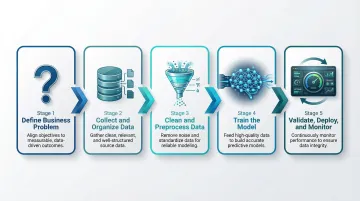
Predictive analytics follows a structured workflow — and at every stage, data quality matters more than algorithm sophistication.
Define the Business Problem
Every project starts with a clear question: "Which customers are likely to churn in the next 30 days?" or "What will equipment failure rates look like next quarter?" A well-scoped problem determines which model type you'll need and what data you'll require. Vague questions produce vague models.
Collect and Organize Data
Data must be gathered from relevant sources—CRM systems, transactional databases, sensor logs, spreadsheets—and organized into a structured repository. According to Anaconda's 2022 State of Data Science report, data professionals spend 37.75% of their time on data preparation and cleansing, compared to just 26.44% on model training and deployment. Data quality at this stage directly determines model accuracy downstream.
Clean and Preprocess Data
Raw data contains missing values, outliers, duplicate records, and inconsistencies. These must be resolved before modeling begins. Historical surveys indicate data scientists have spent up to 60% of their time cleaning data, with data collection pushing that figure to 80%. This step is often the most time-consuming in practice—and the most critical for model accuracy.
Develop and Train the Model
Data scientists select an appropriate algorithm—regression, decision tree, or neural network—and train it on a historical dataset. The dataset is split into training data (to build the model) and testing data (to validate it).
Models are then iteratively refined, balancing accuracy with interpretability depending on how the output will be used.
Validate, Deploy, and Monitor
Models are tested against held-out data using accuracy metrics such as:
- Precision and recall for classification problems
- Mean absolute error for numeric forecasts
Once validated, models move into production — powering dashboards, automated workflows, and real-time scoring engines. Monitoring is continuous: as new data arrives, models are retrained to stay accurate as business conditions shift.
Key Predictive Analytics Techniques
The right technique depends on your data structure and the outcome you're predicting. Here are the four primary approaches.
Regression Analysis
Regression models identify relationships between variables to predict continuous outcomes. Linear regression fits a straight-line relationship (e.g., how will a 10% price increase affect revenue?). Logistic regression predicts binary outcomes by fitting an S-shaped curve that outputs probabilities between 0 and 1—ideal for yes/no questions like "Will this customer churn?" or "Is this transaction fraudulent?"
Strengths: Simple, interpretable, fast to train.
Limitations: Assumes linear relationships; struggles with complex, non-linear patterns.
Decision Trees and Classification Models
Decision trees partition data into branches based on learned conditions, creating a hierarchical structure that's easy to visualize. They excel at categorizing outcomes—which customer segment will respond to an offer? Which patients are high-risk for readmission? Decision trees handle both numeric and categorical data well and tolerate missing values better than regression models.
Strengths: Highly interpretable; works with messy data.
Limitations: Prone to overfitting without pruning or ensemble methods like random forests.
Neural Networks and Deep Learning
Neural networks use layers of interconnected nodes to model complex, non-linear relationships in high-dimensional data. They're the preferred technique for processing unstructured data (images, text, audio) and detecting subtle patterns in volatile datasets like financial markets. Mastercard's AI-driven fraud detection reduced false positives tenfold, saving billions for merchants.
Strengths: Handles extreme complexity; excels at pattern recognition.
Limitations: Requires massive training datasets; operates as a "black box" with limited interpretability.
Time Series Models: ARIMA and Exponential Smoothing
Time series models are designed for sequential, time-ordered data. ARIMA (AutoRegressive Integrated Moving Average) captures trends and autocorrelation structure by modeling a series through its own lagged values and past forecast errors. Exponential Smoothing (ETS) assigns exponentially decreasing weights to older observations, making recent data count more, making it well-suited for data with clear trends and seasonality like retail sales or energy demand.
Both techniques work well for period-by-period forecasting, though they suit different scenarios. ARIMA performs best for stationary data with strong autocorrelation, while ETS handles seasonal patterns more naturally.
Real-World Applications of Predictive Analytics
Predictive analytics has moved from theory to measurable financial impact across industries.
Finance: Credit Scoring and Fraud Detection
The FICO Score, built on predictive analytics, is used by 90% of top U.S. lenders to make billions of credit decisions annually. In fraud detection, machine learning models continuously learn from new data to flag anomalies before fraud escalates. Visa's Decision Manager screened 3.2 billion transactions in 2023, preventing an estimated $33 billion in potential fraud losses through automated risk scoring.
Healthcare: Patient Readmissions and Predictive Maintenance
Hospitals use predictive models to improve patient outcomes and optimize operations. Children's Hospital of Orange County (CHOC) developed a machine learning algorithm that improved its 30-day readmission prediction model AUC from 0.79 to 0.822. Pushing these real-time risk scores to clinicians at discharge resulted in sustained drops in actual readmission rates.
Beyond patient care, predictive maintenance of medical equipment drives sustainability. A 2026 MDPI study found that AI-enabled predictive maintenance reduced aggregate electricity use by 10–22% compared to baseline preventative maintenance by predicting equipment failures before they occurred.
Retail and Marketing: Inventory Optimization and Personalization
Demand forecasting is where predictive analytics often delivers the fastest, most visible ROI in retail. The Otto Group reduced its stockout rate by 80% using machine learning to forecast demand and adjust production ahead of shifts in buying patterns.
The personalization side is equally striking. Signet Jewelers achieved an 88.6% conversion lift and 147.2% revenue-per-visitor uplift by targeting anonymous website visitors with predictive models based on prior spending behavior.
McKinsey research confirms the broader trend: companies using targeted, AI-driven promotions see 1–2% lifts in overall sales and 1–3% margin improvements.
Why Predictive Analytics Matters for Business Teams
Organizations that act on predictions outperform those that react to reports. Gartner projects that by 2030, 70% of large organizations will adopt AI-based supply chain forecasting to predict future demand — enabling touchless forecasting that eliminates manual inputs and speeds up decisions at every level. The shift isn't just operational. It's about who sees what's coming first.
That advantage shows up across three areas business teams care about most:
- Earlier intervention: Predictive models let teams act before problems surface — preventing churn before customers leave, avoiding stockouts before shelves empty, scheduling maintenance before equipment fails.
- Automatic scale: Once validated, a model can score millions of records without manual effort. That frees analysts to focus on decisions, not repetitive reporting.
- Long-term ROI: A 2025 Deloitte/PwC survey found most organizations reach satisfactory AI ROI within 2 to 4 years, with only 13% seeing returns in the first 12 months.
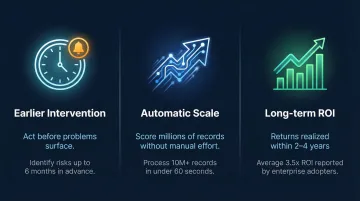
The runway is longer than many expect. Still, 65% of executives now call AI a core part of their corporate strategy — a sign that the returns, when they arrive, tend to be durable.
How AI Is Making Predictive Analytics More Accessible
Traditionally, building predictive models required dedicated data scientists, SQL expertise, and weeks of development time. This created a bottleneck between business questions and data-driven answers—business users had to wait for technical teams to build custom reports, delaying decision-making and limiting analytics adoption.
The shift to natural language querying: Modern AI platforms now allow business users to ask questions in plain English and receive forecasts, trend analysis, or anomaly alerts without writing code. Gartner forecasts that by 2026, 90% of analytics consumers will become content creators, enabled by natural language query (NLQ) interfaces and AI assistants. By 2027, 75% of new analytics content will use generative AI for enhanced contextual intelligence.
This democratization addresses a critical talent gap. Demand for data insights far outpaces the supply of trained data scientists. By empowering business users with self-service analytics, organizations alleviate bottlenecks on IT and data teams while accelerating time-to-insight.
Sylus illustrates how this shift plays out in practice. It connects directly to business data sources, validates assumptions automatically, and generates shareable dashboards—without requiring SQL expertise. A user can ask "What were total sales for each sales rep from the last 12 months?" and get an instant visualization in seconds.
Key capabilities that support this accessibility include:
- Connects to 500+ data sources with analysis grounded in dbt models for governed context
- Natural language queries answered directly from Slack, inside existing team workflows
- Unlimited seats with usage-based pricing, so organizations can roll out analytics across entire teams without per-seat constraints
Frequently Asked Questions
What does predictive AI mean?
Predictive AI refers to artificial intelligence systems that use machine learning and statistical models to analyze historical data and generate probability-based forecasts about future events. Unlike traditional predictive analytics, these systems use neural networks and automated model training to deliver faster, more accurate predictions at scale.
What is predictive thinking?
Predictive thinking is the cognitive practice of using available data, patterns, and past experience to anticipate future outcomes and make proactive decisions. In business contexts, this mindset is formalized and scaled through predictive analytics tools that systematically apply statistical reasoning to data.
What is the difference between predictive analytics and forecasting?
Forecasting is a specific application of predictive analytics focused on projecting time-series values (e.g., next quarter's revenue or monthly demand). Predictive analytics is the broader discipline that also includes classification models (will this customer churn?), risk scoring (fraud probability), and behavioral prediction (which users will respond to an offer?).
What are the most common predictive analytics techniques?
The four primary techniques are regression analysis (linear and logistic), decision trees, neural networks, and time series models like ARIMA and exponential smoothing. The right choice depends on whether you're predicting continuous outcomes, binary classifications, complex non-linear patterns, or time-ordered sequences.
How is AI changing predictive analytics?
AI is making predictive analytics faster to build and easier to use. Natural language querying lets business users ask questions in plain English, automated model validation cuts development time, and AI-generated summaries surface insights without manual analysis—putting data-driven decisions within reach for non-technical teams across an organization.